
Sector Rotation Trends面向 AI 投资研究的
板块轮动地图
Read a sector rotation chart for stock market trends, ETF flows, relative strength, earnings revisions, valuation, and catalysts with source-backed AI research briefs.
用 QVeris AI agents 把板块轮动、ETF 资金流、相对表现、盈利预测修正、估值和市场催化因素整理成可追溯的投资研究简报。
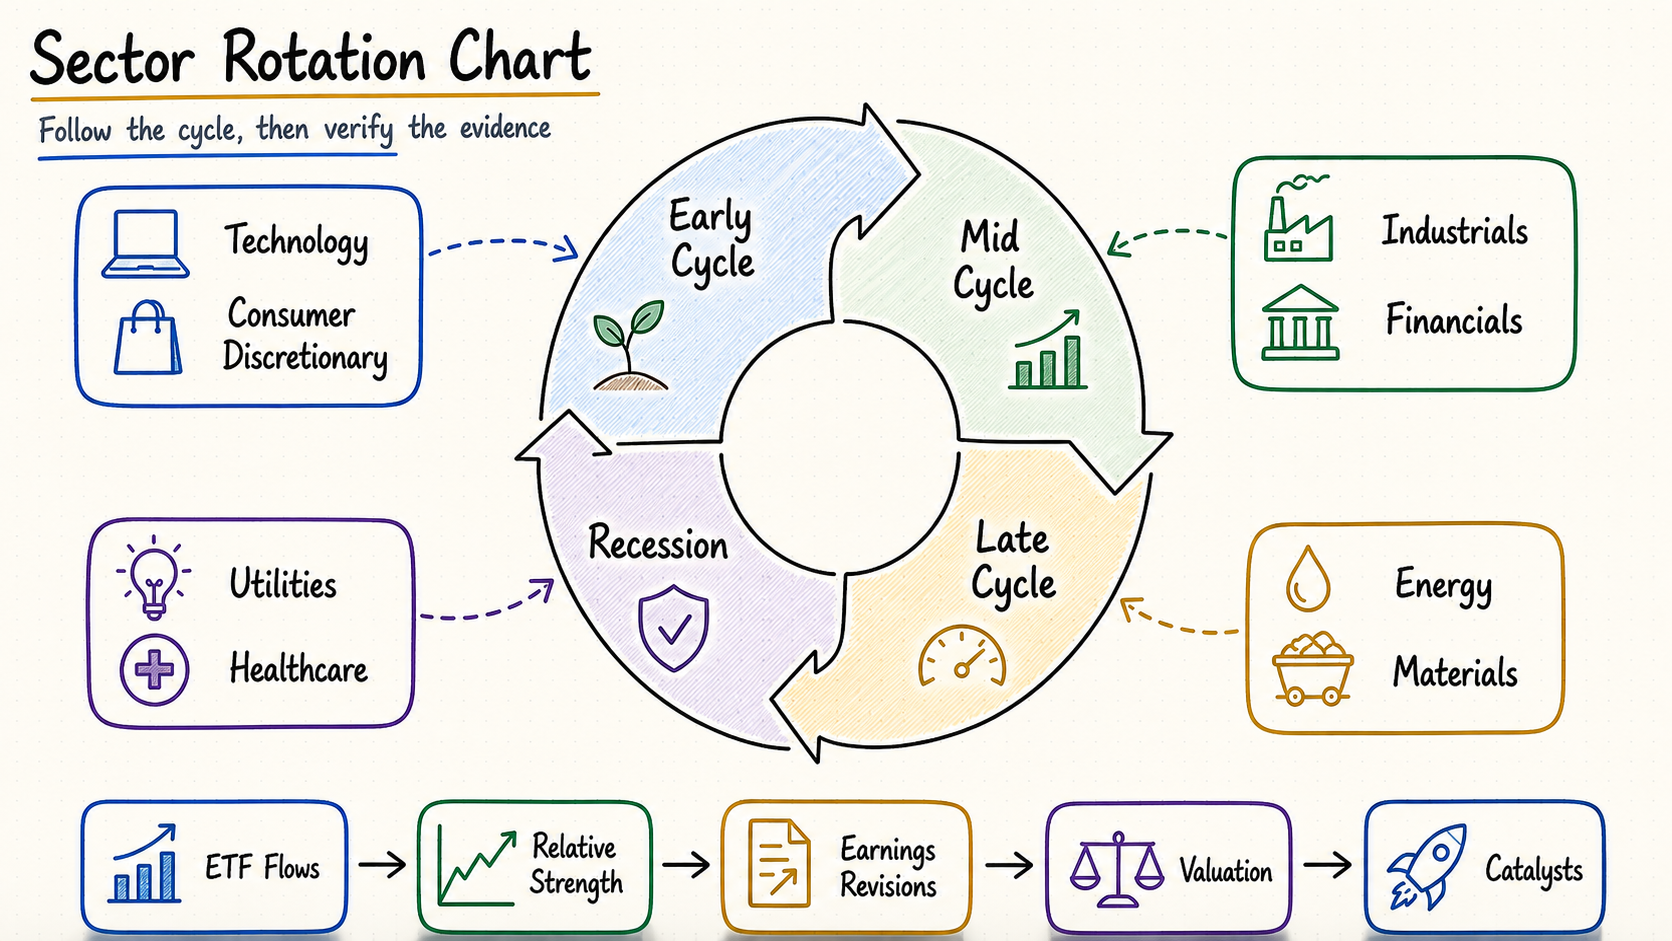
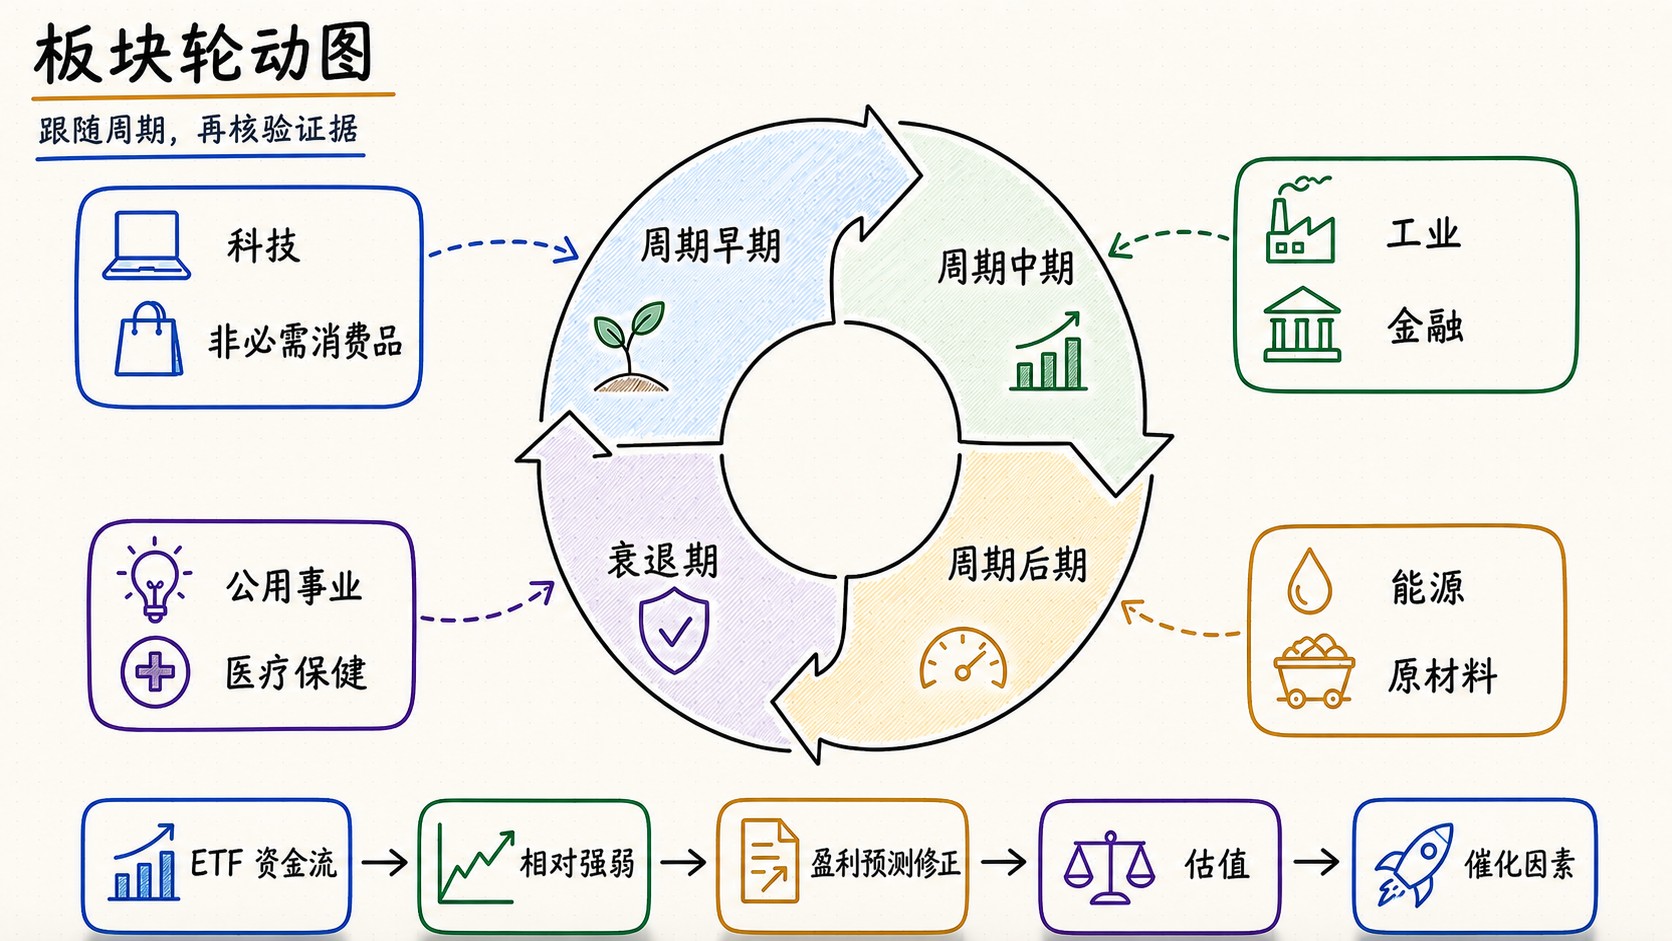
What Is a Sector Rotation Chart?
Sector rotation is the movement of market leadership from one industry sector to another. Investors track it to understand whether capital is moving toward growth, defensives, cyclicals, financials, energy, technology, healthcare, or other market groups as macro conditions change.
This QVeris scenario uses the high-volume keyword sector rotation as the traffic entry point, then connects it to the QVeris Sector Rotation Chart skill. The workflow helps agents combine sector performance, ETF flows, earnings revisions, valuation, and catalysts into a source-backed investment research brief.
What a Sector Rotation Chart Watches
A useful map explains leadership changes with multiple signals instead of treating sector performance as a standalone chart.
Sector Performance
Compare relative strength, momentum, drawdowns, breadth, and leadership changes across major equity sectors.
ETF Flow Signals
Track inflows and outflows in sector ETFs to understand where capital is moving and where conviction is fading.
Earnings Revisions
Review analyst estimate changes, upgrade or downgrade pressure, and earnings momentum behind sector moves.
Valuation Context
Compare sector multiples, valuation spreads, premium or discount signals, and where price has already moved too far.
Macro Catalysts
Connect interest rates, inflation, policy, commodity prices, credit conditions, and risk sentiment to market rotation.
Evidence Strength
Return source notes, data gaps, confidence signals, and next checks so analysts can audit the sector rotation thesis.
How QVeris Routes Sector Rotation Workflows
QVeris keeps the workflow agent-native: discover relevant capabilities, inspect schemas, call the skill, then return structured rotation output.
// Example sector rotation chart workflow
goal: "Explain current sector leadership and rotation risk"
discover: sector performance, ETF flows, revisions, valuation, macro catalysts
inspect: sector taxonomy, data freshness, source scope, evidence fields
call: "QVeris Sector Rotation Chart skill"
output: sector map, leadership changes, catalyst notes, sources, audit appendix
Where Sector Rotation Analysis Fits
The same workflow can support portfolio monitoring, market briefings, thematic research, and ETF strategy review.
Weekly Market Briefings
Summarize which sectors are leading, lagging, or reversing, with evidence behind the move.
Portfolio Risk Review
Identify sector concentration, crowded leadership, defensive shifts, and risk-on or risk-off market behavior.
ETF Strategy Monitoring
Connect sector ETF flows, performance spreads, and catalysts to help research sector allocation ideas.
QVeris Sector Rotation Chart Skill
Use the actual QVeris skill to map sector performance, flows, earnings revisions, valuation, and catalysts.
Static Sector Chart vs QVeris Rotation Workflow
| Need | Static sector chart | QVeris sector-rotation workflow |
|---|---|---|
| Find sector leaders | Sort by recent performance only | Compare performance, breadth, flows, revisions, valuation, and catalysts |
| Explain rotation | Analyst manually checks macro, ETF flows, and earnings context | Returns a source-backed narrative for why leadership is changing |
| Assess conviction | Evidence sits across separate tools and notes | Includes evidence strength, source trail, and data gaps |
| Repeat the workflow | Manual refresh for every market note | Reusable AI agent workflow for daily or weekly monitoring |
Useful Sector Rotation References
External references help readers understand sectors, ETF flows, and market rotation research context.
S&P 500 Sector Indices
Reference for major S&P sector index families used in market and sector performance analysis.
iShares Sector Investing
ETF-focused reference for sector investing concepts, sector exposure, and allocation workflows.
Investopedia Sector Rotation
Introductory explanation of sector rotation and how investors interpret sector leadership changes.
Sector Rotation FAQ
What is sector rotation?
How do investors identify sector rotation?
Why use AI agents for sector rotation analysis?
Which QVeris skill is connected to this page?
Build a Sector Rotation Research Agent
Use QVeris to connect sector rotation signals, ETF flows, earnings revisions, valuation, catalysts, and source-backed briefs in one agent workflow.
Open Market Sector Performance Tool面向 AI 投资研究的板块轮动地图
Read a sector rotation chart for stock market trends, ETF flows, relative strength, earnings revisions, valuation, and catalysts with source-backed AI research briefs.
用 QVeris AI agents 把板块轮动、ETF 资金流、相对表现、盈利预测修正、估值和市场催化因素整理成可追溯的投资研究简报。
什么是板块轮动?
板块轮动是市场领导力从一个行业板块转向另一个行业板块的过程。投资者会用它判断资金是否正在流向成长、防御、周期、金融、能源、科技、医疗等不同市场分组。
这个 QVeris 场景用大流量关键词 sector rotation 作为入口,再连接到 QVeris Sector Rotation Chart skill。它可以帮助 agents 把板块表现、ETF 资金流、盈利预测修正、估值和催化因素整理成有来源支撑的投资研究简报。
板块轮动地图应该看什么
好的轮动地图不只是板块涨跌榜,而是用多类信号解释市场领导力为什么变化。
板块表现
比较主要股票板块的相对强弱、动量、回撤、市场宽度和领导力变化。
ETF 资金流信号
追踪板块 ETF 的流入和流出,判断资金正在流向哪里、哪些方向信心减弱。
盈利预测修正
查看分析师预期变化、上调或下调压力,以及板块背后的盈利动量。
估值背景
比较板块倍数、估值差、溢价或折价,判断价格是否已经走得过远。
宏观催化因素
把利率、通胀、政策、商品价格、信用环境和风险偏好连接到市场轮动。
证据强度
返回来源说明、数据缺口、置信度信号和下一步核查项,方便分析师审计轮动观点。
QVeris 如何路由板块轮动 workflow
QVeris 保持 agent-native 的流程:先发现相关能力,检查 schema,再调用 skill,最后返回结构化轮动输出。
// 板块轮动地图 workflow 示例
goal: "解释当前板块领导力和轮动风险"
discover: 板块表现、ETF 资金流、盈利修正、估值、宏观催化因素
inspect: 板块分类、数据新鲜度、来源范围、证据字段
call: "QVeris Sector Rotation Chart skill"
output: 板块地图、领导力变化、催化因素、来源、审计附录
板块轮动分析适合哪些场景
同一个 workflow 可以服务组合监控、市场简报、主题研究和 ETF 策略复盘。
每周市场简报
总结哪些板块在领先、落后或反转,并说明背后的证据。
组合风险复盘
识别板块集中度、拥挤领导力、防御切换,以及 risk-on / risk-off 行为。
ETF 策略监控
把板块 ETF 资金流、表现差异和催化因素连接起来,辅助研究板块配置机会。
QVeris Sector Rotation Chart Skill
使用真实 QVeris skill 映射板块表现、资金流、盈利预测修正、估值和催化因素。
静态板块图 vs QVeris 轮动 workflow
| 需求 | 静态板块图 | QVeris 板块轮动 workflow |
|---|---|---|
| 找到领先板块 | 只按近期表现排序 | 综合表现、宽度、资金流、盈利修正、估值和催化因素 |
| 解释轮动原因 | 分析师手动检查宏观、ETF 资金流和盈利背景 | 返回有来源支撑的市场领导力变化叙事 |
| 判断可信度 | 证据分散在不同工具和笔记里 | 包含证据强度、来源链路和数据缺口 |
| 重复使用流程 | 每次市场笔记都要手动刷新 | 可复用的 AI agent workflow,适合每日或每周监控 |
有用的板块轮动参考
外部资料可以帮助读者理解板块、ETF 资金流和市场轮动研究背景。
S&P 500 Sector Indices
用于市场和板块表现分析的 S&P 主要板块指数参考。
iShares Sector Investing
关于板块投资、板块敞口和 ETF 配置工作流的参考资料。
Investopedia Sector Rotation
介绍 sector rotation 以及投资者如何理解板块领导力变化。