
I Had QVeris Read Apple’s Fundamentals: The Three Statements, As Reported Data, and TTM Metrics Are All Connected
QVeris · Data Test
This article is part of the QVeris × FMP series on fundamental financial statement data, written for WeChat Official Account readers. The core story is simple: “I asked QVeris to truly examine Apple’s fundamentals.” All key figures come from data successfully returned by QVeris through FMP calls.
When a user asks, “How are Apple’s fundamentals?”, looking up PE is nowhere near enough
Recently, I wanted to test a question that looks very simple:
How are Apple’s fundamentals?
If you give this question to an ordinary Agent, it is easy to get an answer that sounds professional but is actually very thin: Apple is a global technology leader, revenue is stable, margins are high, PE is such and such, cash flow is strong.
None of that sounds wrong. But the biggest issue with this type of answer is that it does not know what data it is relying on.
Fundamental analysis does not end with looking up one PE ratio. At minimum, you need three layers of information: the income statement tells you how much money the company made; the balance sheet tells you what asset and liability structure it used to make that money; the cash flow statement tells you whether profits turned into cash. Going deeper, you also need As Reported raw disclosure data, TTM metrics, financial ratios, and growth rates.
Otherwise, an Agent can easily become a “financial adjective generator.” Stable, strong, high-quality, deep moat. The writing may be smooth, but it never lands on the numbers.
So this time I used AAPL as the sample and had QVeris call FMP directly, to see whether it could actually run the fundamental data workflow for Apple end to end.
I first asked QVeris to pull the income statement: five years of revenue and net income establish the baseline
The first step was asking QVeris to call FMP’s Income Statement.
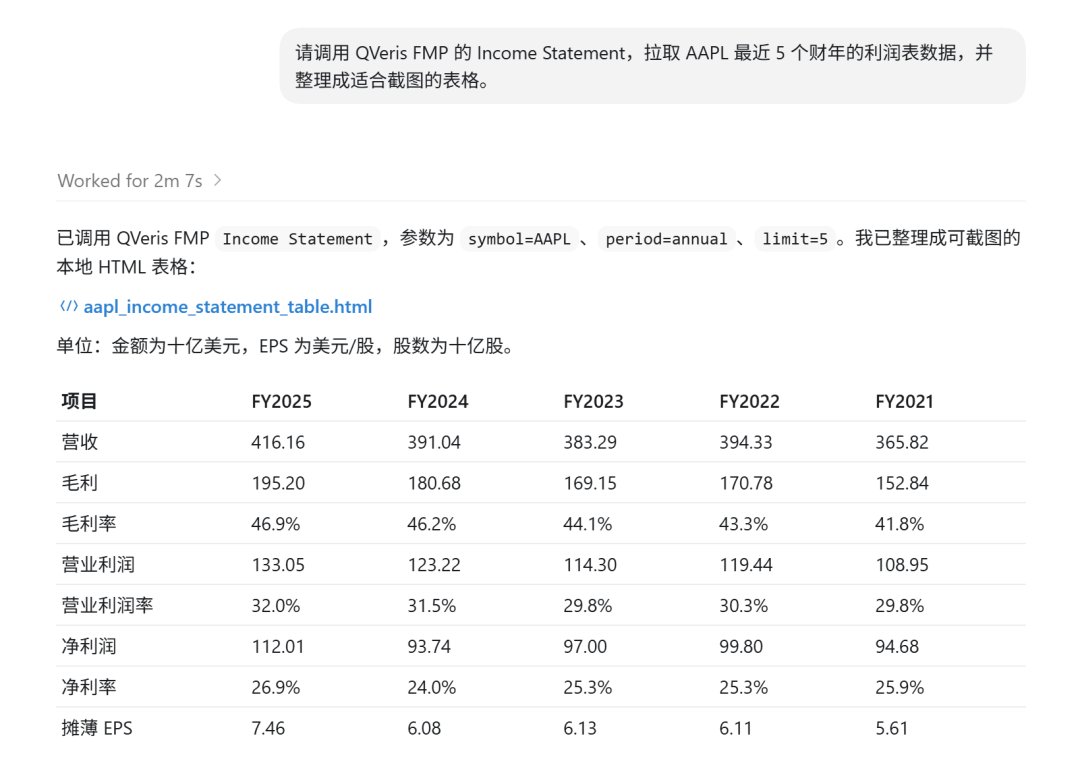
The returned result was clean: the latest 5 fiscal years for AAPL were available, with fields including revenue, grossProfit, operatingIncome, netIncome, EPS, R&D, SG&A, filingDate, acceptedDate, and more.
Before getting into complex models, we can first look at the most basic five-year trajectory.
| Fiscal Year | Revenue | Net Income | EPS |
|---|---|---|---|
| 2025 | USD 416.161 billion | USD 112.010 billion | 7.49 |
| 2021 | USD 365.817 billion | USD 94.680 billion | 5.67 |
This set of numbers is already much more useful than saying “Apple is a great company.” At the very least, it tells us that over the past five years, Apple’s revenue moved from USD 365.8 billion to USD 416.2 billion, while net income moved from USD 94.7 billion to USD 112.0 billion. That is not an adjective. It is a line of evidence that can be examined further.
What does this mean for an Agent? It can finally establish the company’s fundamental baseline. When answering questions about Apple’s fundamentals, it no longer has to write “revenue is stable” based on impression. It can first present continuous data for revenue, net income, and EPS, then judge whether the story is growth, stagnation, or structural change.
Then the balance sheet: what asset structure sits behind the earnings?
The income statement answers “how much did it earn,” but that is not enough.
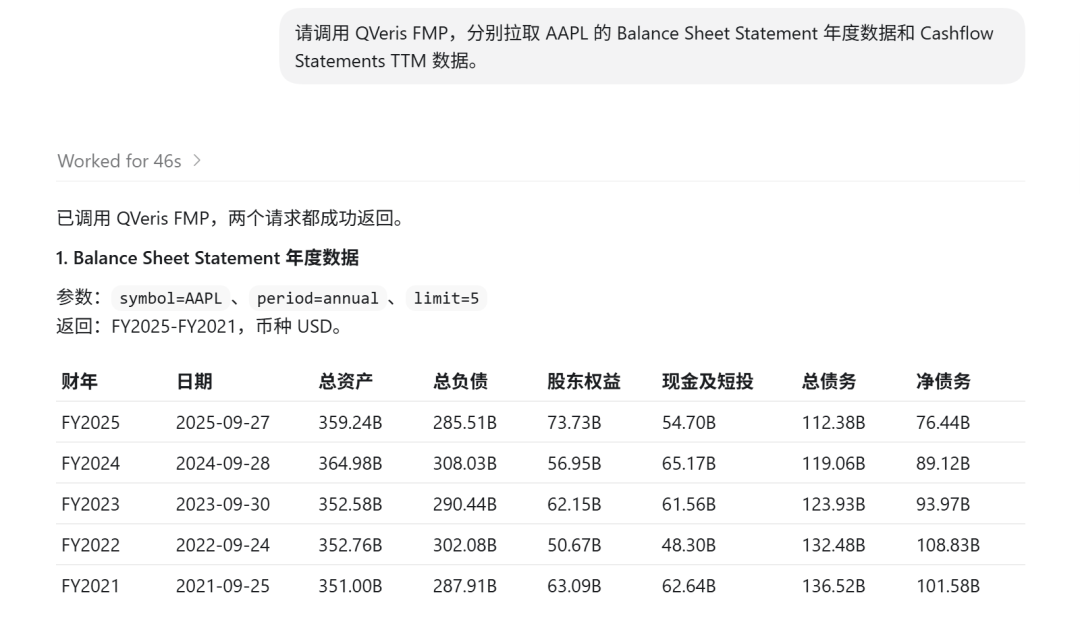
Next, I asked QVeris to pull the Balance Sheet Statement. AAPL’s 2025 fiscal-year balance sheet also returned normally.
| Metric | AAPL 2025 FY |
|---|---|
| Total Assets | USD 359.241 billion |
| Total Liabilities | USD 285.508 billion |
| Shareholders’ Equity | USD 73.733 billion |
| Cash and Cash Equivalents | USD 35.934 billion |
| Total Debt | USD 112.377 billion |
| Net Debt | USD 76.443 billion |
This step matters because many Agents look at a company by staring only at the income statement. That is like reading only body weight in a medical report and ignoring blood pressure, heart rate, and liver function. High net income is certainly good, but how many assets did the company use? What does the liability structure look like? Is there enough cash? These answers are all on the balance sheet.
With this table, the Agent can move one step beyond “Apple is highly profitable” and begin to understand Apple’s capital structure. It can see that Apple is not just a floating profit number, but a company with assets, debt, cash, equity, and traces left by long-term buybacks and capital allocation decisions.
What does this mean for an Agent? It is no longer just reading profit. It can look at “earning power” together with “asset and liability structure.” That is a step from beginner-level fundamental analysis toward something usable.
Cash flow is the real test: did profit become real cash?
Going one level deeper, the thing I care most about is cash flow.
The income statement can look beautiful, but cash flow tells the truth. Especially for a fundamental analysis Agent, if it cannot distinguish between “accounting profit” and “real cash,” it can easily produce polished but empty commentary.
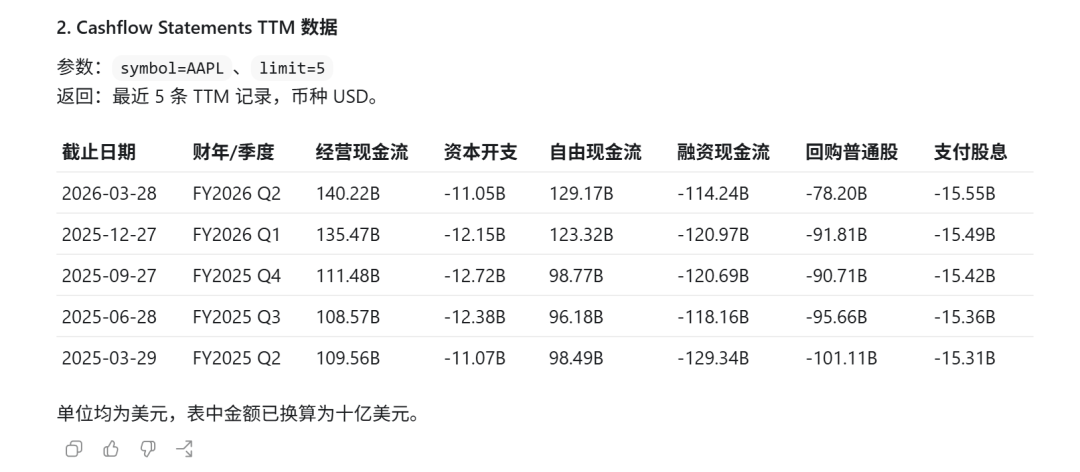
This time I asked QVeris to call FMP’s Cashflow Statements TTM. AAPL returned TTM data through fiscal 2026 Q2, with data dated 2026-03-28: operating cash flow of USD 140.222 billion, free cash flow of USD 129.174 billion, capital expenditure of USD 11.048 billion, and net income of USD 122.575 billion.
This set of numbers is interesting. Apple’s TTM operating cash flow is higher than net income, and free cash flow remains at the USD 129.174 billion level. In other words, profit did not just remain on the statement. It really did turn into substantial cash.
This is the kind of judgment a fundamental analysis Agent should be able to make. It should not merely recite the cash flow fields. It should be able to ask the next questions: How does operating cash flow compare with net income? Is free cash flow enough to support buybacks, dividends, and reinvestment? Is the capital expenditure ratio high?
What does this mean for an Agent? It can begin to judge “earnings quality.” An Agent that only looks up net income is, at best, producing a financial summary. An Agent that can follow cash flow is much closer to doing real investment research.
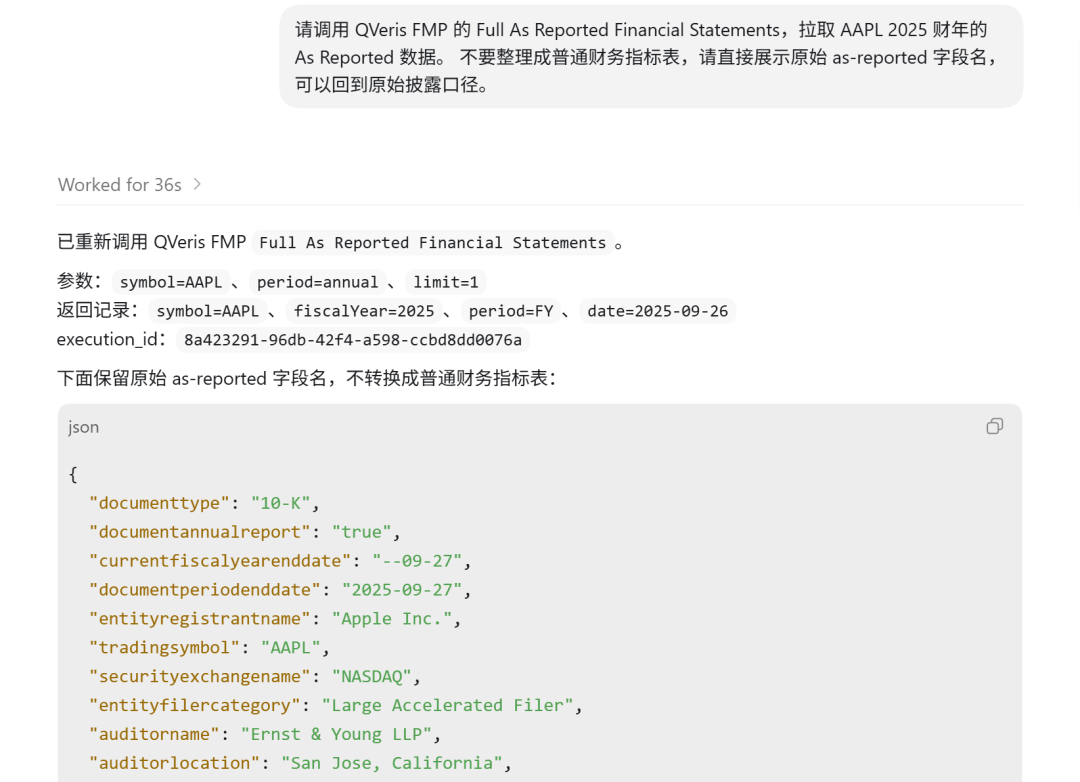
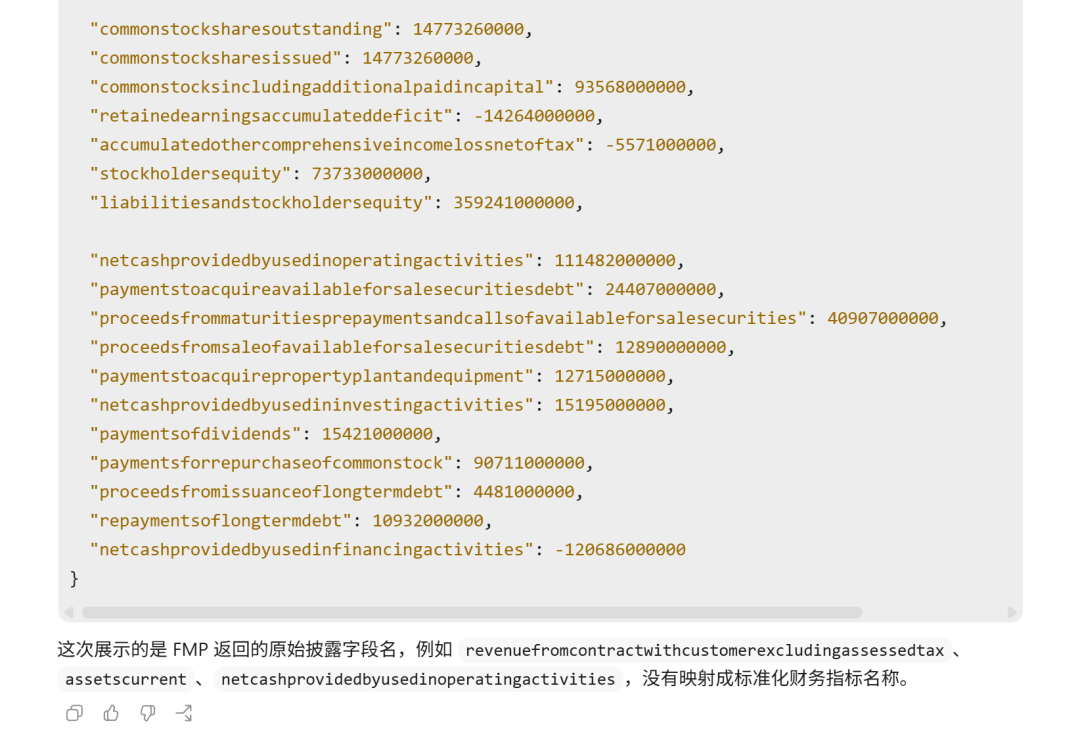
The value of As Reported: returning to the original disclosure basis when needed
Standardized financial statements are useful, but professional investment research cannot avoid another question: how did these numbers come from the original disclosures?
So I also tested FMP’s Full As Reported Financial Statements. QVeris successfully returned AAPL’s 2025 data. It included documenttype as 10-K, entityregistrantname as Apple Inc., auditorname as Ernst & Young LLP, and fields closer to the original disclosure basis, such as revenuefromcontractwithcustomerexcludingassessedtax, costofgoodsandservicessold, netincomeloss, and netcashprovidedbyusedinoperatingactivities.
This part is not suitable to throw directly at ordinary users. The field names look like accounting standards fell onto a keyboard. They are not friendly to read.
But they are extremely important for an Agent.
Standardized data solves the “usability” problem. As Reported data solves the “traceability” problem. If a user asks, “Which original 10-K disclosure item does this revenue number correspond to?”, the Agent cannot simply say, “I think it should be this.” It needs a way to return to the original disclosure basis and verify.
What does this mean for an Agent? It can first use standardized three-statement data for fast analysis, then return to As Reported data for verification when needed. This capability moves the Agent from “has seen the summary” to “can trace the source.”
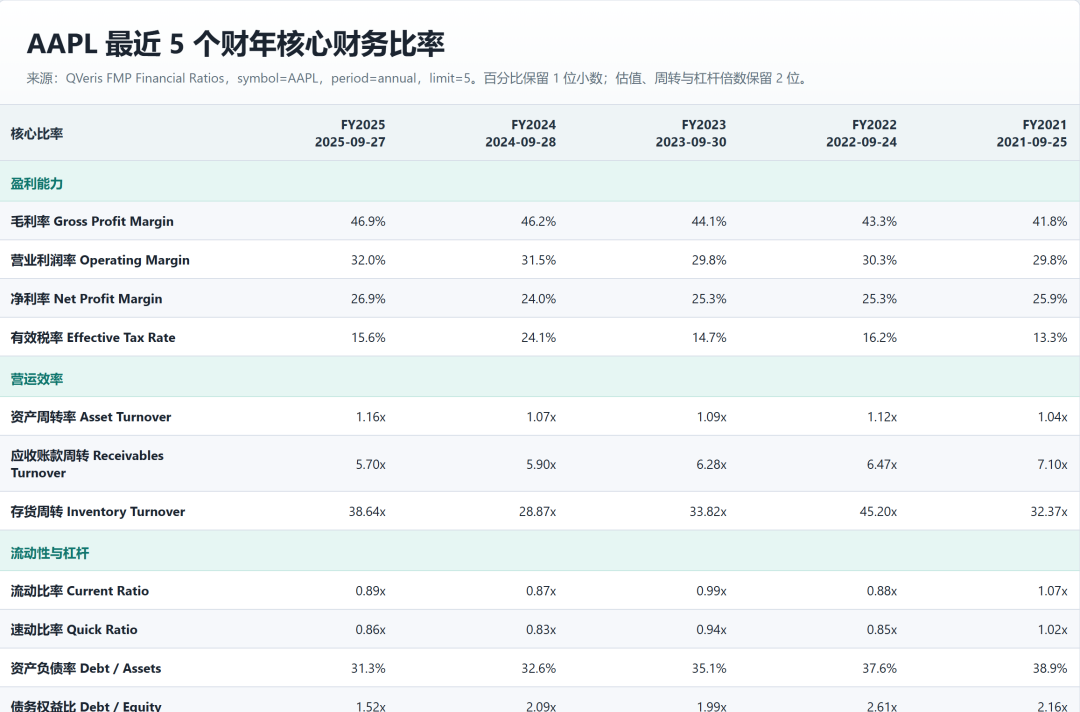
Ratios, TTM, and Growth: turning lookup into judgment
The three statements are the raw material, but what users really want is judgment.
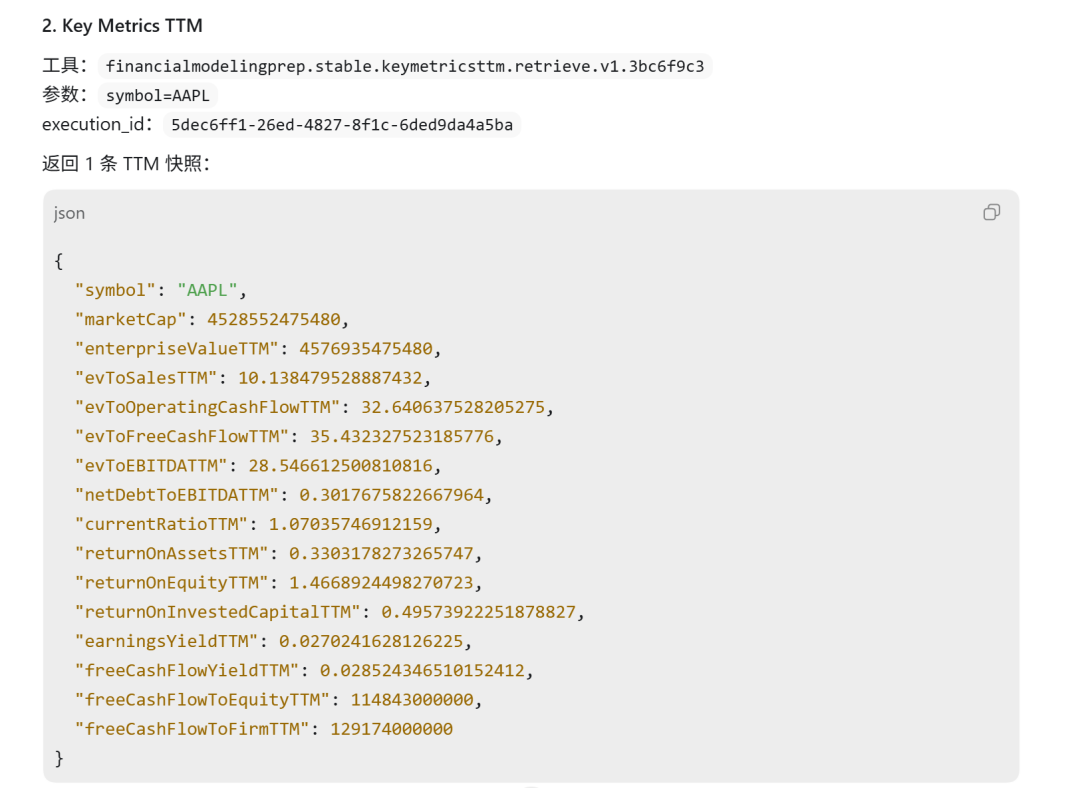
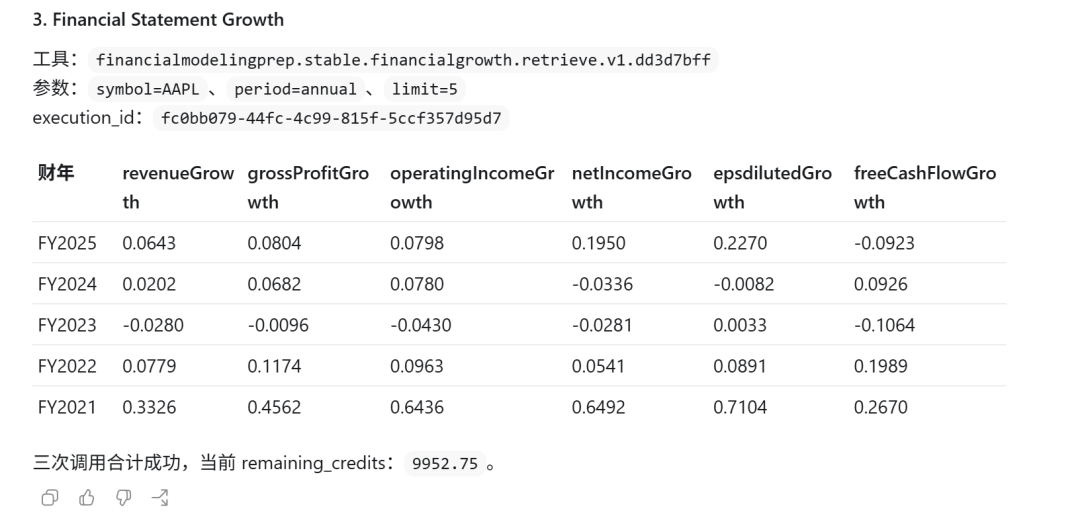
So I continued by asking QVeris to pull Financial Ratios, Key Metrics TTM, and Financial Statement Growth.
| Category | Tested Metric | Returned Value |
|---|---|---|
| Financial Ratios | Gross Margin | 46.91% |
| Financial Ratios | Net Margin | 26.92% |
| Financial Ratios | PE | 34.09 |
| Key Metrics TTM | ROA TTM | 33.03% |
| Key Metrics TTM | ROE TTM | 146.69% |
| Key Metrics TTM | ROIC TTM | 49.57% |
| Key Metrics TTM | Cash Conversion Cycle | -35.21 days |
| Growth | 2025 Revenue Growth | 6.43% |
| Growth | 2025 Net Income Growth | 19.50% |
| Growth | 2025 EPS Growth | 22.59% |
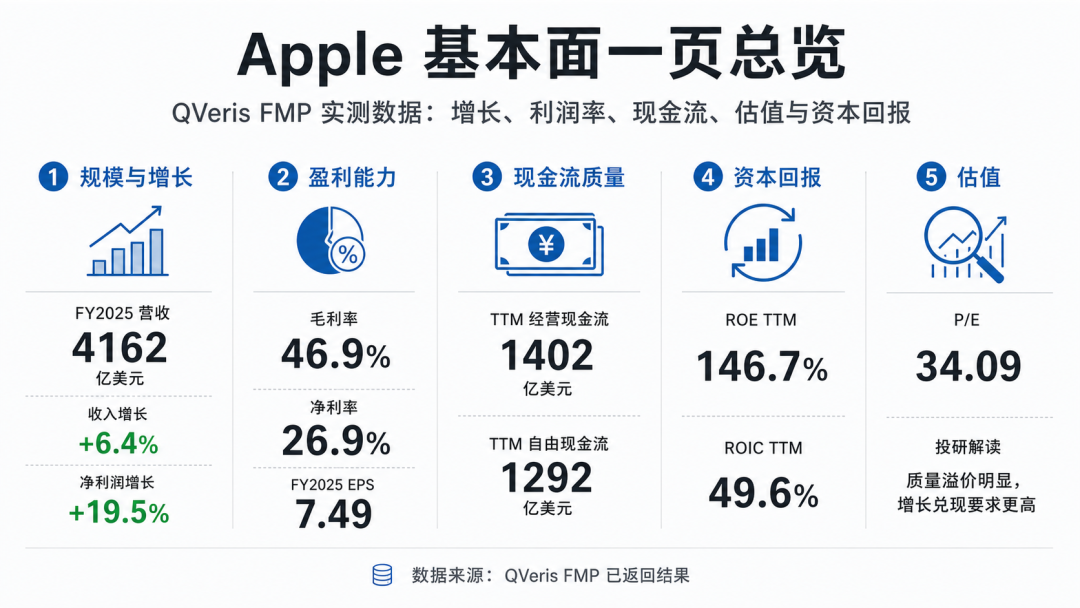
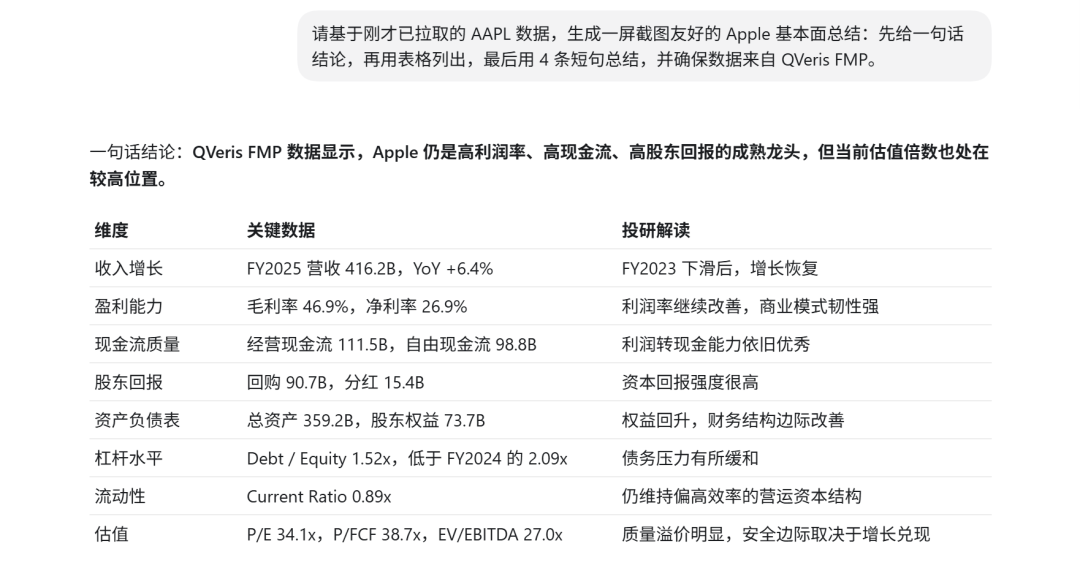
At this point, the Agent finally has enough context to answer “How are Apple’s fundamentals?”
It can say: Apple’s revenue was still growing in 2025, and net income grew faster than revenue; margins remained very high, with gross margin close to 47% and net margin close to 27%; on a TTM basis, ROIC was close to 50%, and free cash flow exceeded USD 129.0 billion; on valuation, PE was 34.09, which is not cheap, but it is backed by extremely strong cash generation and capital returns.
The point of this paragraph is not that it “sounds professional.” The point is that every sentence has data behind it.
What does this mean for an Agent? It is no longer just looking up numbers. It can connect the three statements, TTM metrics, ratios, and growth rates into a fundamental judgment chain. When a user asks “How is it?”, the Agent is actually running a full financial analysis workflow behind the scenes.
This is the data foundation a fundamental analysis Agent should have
After this round of testing, my takeaway on QVeris × FMP is clear:
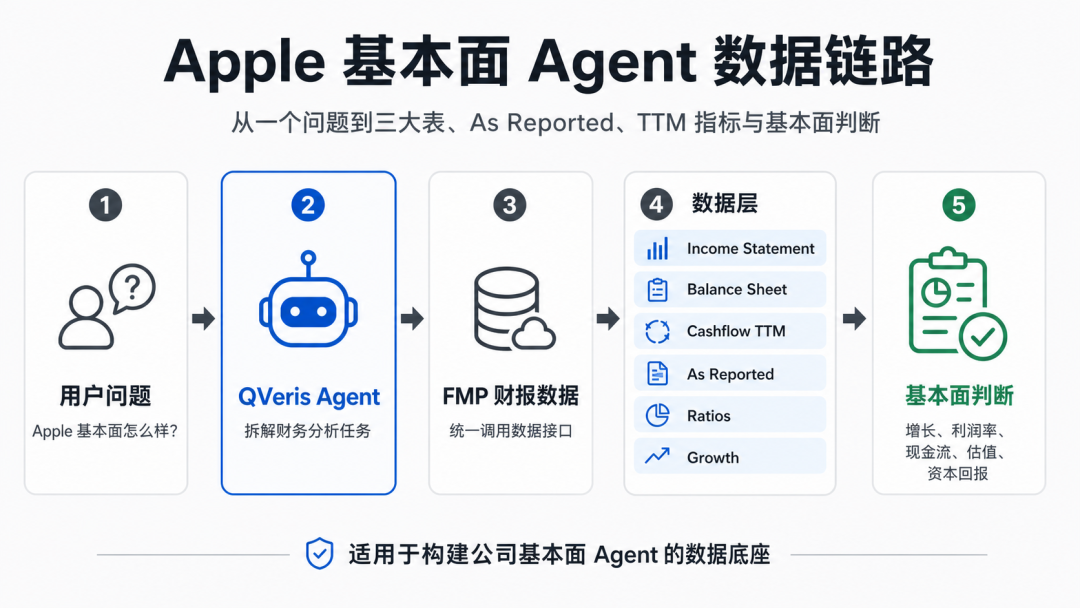
Its value is not simply that it “can look up Apple’s financial statements.” Plenty of data sources can do that. The real value is that QVeris can connect the layers of data needed by a fundamental analysis Agent into one workflow.
Income Statement covers revenue, gross profit, operating income, net income, and EPS; Balance Sheet covers assets, liabilities, cash, debt, and shareholders’ equity; Cashflow TTM checks whether profits turned into cash; As Reported lets the Agent return to the original disclosure basis when needed; Financial Ratios and Key Metrics TTM provide valuation, profitability, capital returns, and operating efficiency; Growth then structures the trend changes.
This is not a “PE lookup tool.” It is the data foundation for a fundamental analysis Agent.
What users will really ask in the future will not be “return Apple’s income statement for me.” They will ask:
Has Apple still been growing over the past few years? How is earnings quality? Is the valuation expensive? Can cash flow support buybacks and dividends? If we go deeper, which indicators should we look at next?
Previously, questions like these required analysts to break the work into more than a dozen steps: find the three statements, align fiscal years, calculate ratios, examine cash flow, then return to original disclosures for verification. Now these steps can be orchestrated by a QVeris Agent.

External messaging point: QVeris has connected FMP’s fundamental financial statement data into a callable data workflow. Developers do not have to build shallow Agents that only “look up PE.” They can directly build company fundamentals Agents covering the three financial statements, As Reported data, TTM metrics, financial ratios, and growth analysis.
QVeris has connected FMP’s fundamental financial statement data into a callable data workflow. Developers do not have to build shallow Agents that only “look up PE.” They can directly build company fundamentals Agents covering the three financial statements, As Reported data, TTM metrics, financial ratios, and growth analysis.