
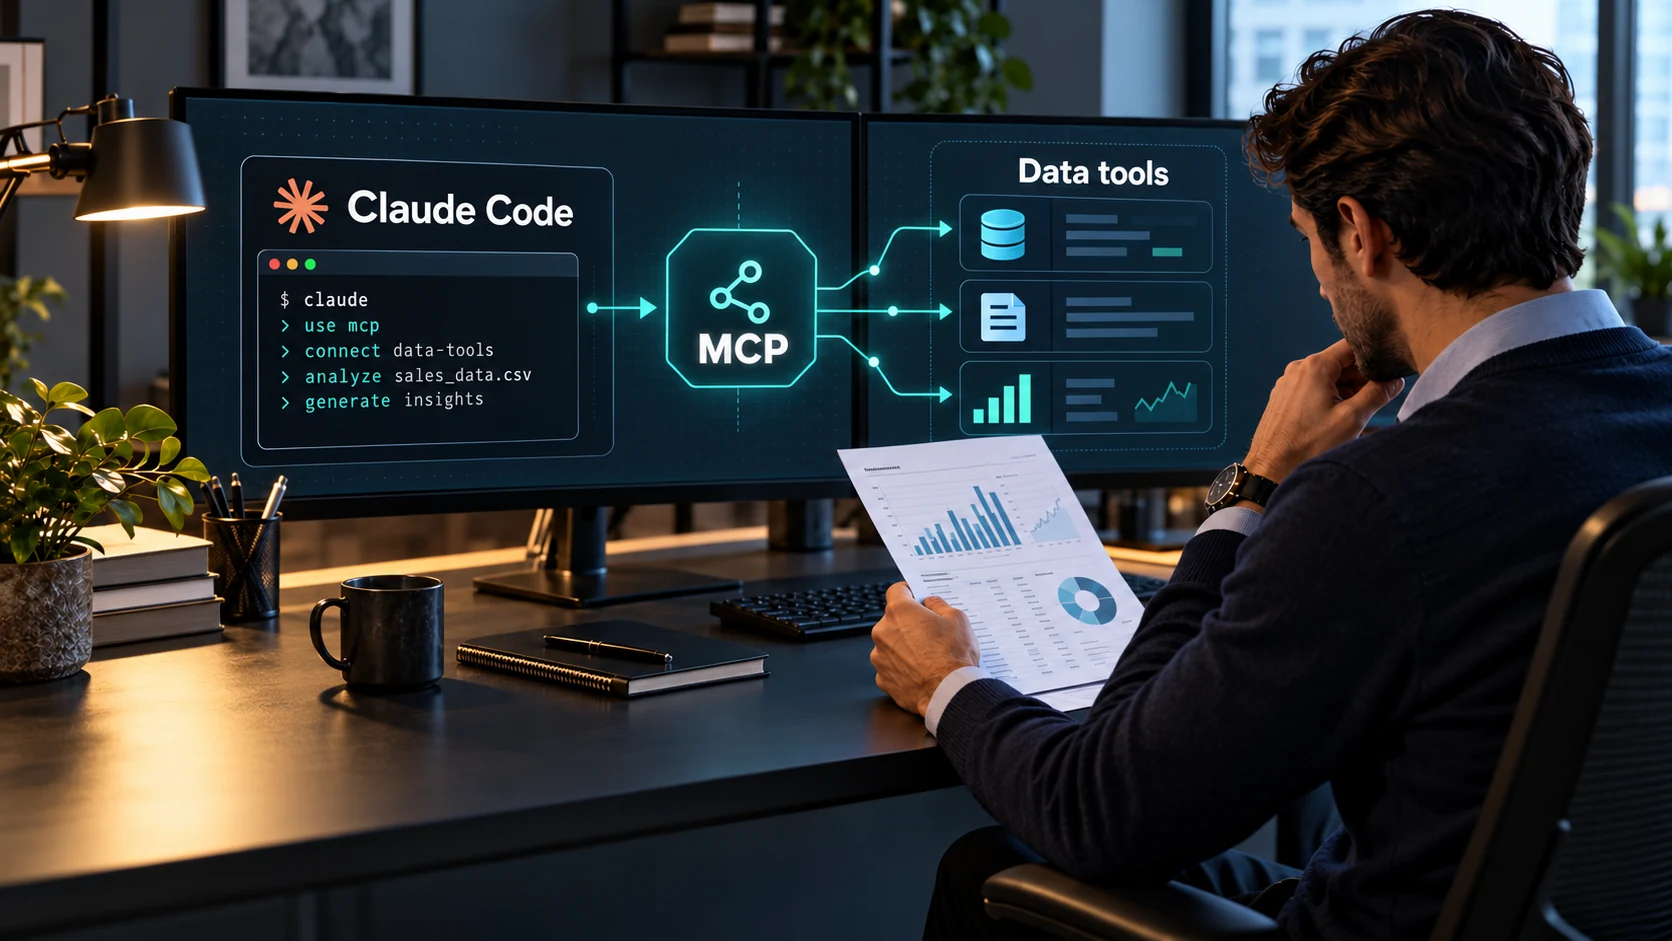
A data workflow you can verify
How can AI agents produce data analysis that can be checked while keeping important judgments in human hands? A reviewable workflow needs a clear definition of metrics and comparison scope, suitable data sources, checks on periods and units, and separate presentation of facts, calculations, and interpretation.
Drawing on Anthropic's research into expert judgment, this guide explains how to connect professional data with Claude Code, MCP, and QVeris. Financial statement verification and analysis of discussions on X illustrate the steps from data retrieval to human oversight. It includes a connection command, reusable prompts, and a reporting template.
Why should data analysts pay attention to Anthropic's research?
In Anthropic research shared by researcher Alex Tamkin, 50 professional analysts completed a task using Claude Code. Across four analytical choices, 86% of their choices aligned with the preference randomly assigned to their agent. This measures agreement between choices and assigned preferences; it does not mean that “86% of experts were controlled by AI.” Read the original research
The study involved a single model and a task lasting about an hour, with deliberately strengthened agent preferences. Participants using agents also took less time and made fewer serious errors, but agent use itself was not randomly assigned, so this comparison cannot establish causation. The study offers a specific reminder: evaluating AI-assisted analysis also requires examining who chooses the metrics and methods.
We care about this at QVeris because access to professional data and human judgment are closely connected. An answer can be free of calculation errors and still depend on the chosen sample, evaluation objective, and basis of comparison. Data helps us inspect the evidence; analysts still need to make explicit choices about how to interpret it.
How do AI agents participate in data analysis and agentic analytics?
Here, data analysis means organizing, calculating, and interpreting data to answer a specific question. Data analytics describes the broader practice of monitoring business metrics, producing reports, and supporting decisions. Agentic analytics emphasizes an agent coordinating multiple steps, such as finding data, calling tools, running calculations, and adjusting subsequent analysis in response to results.
Consider evaluating a company's quarterly performance. An agent might first find financial data, then calculate year-over-year changes, and finally assemble a report. That process includes at least three distinct kinds of work: obtaining facts, selecting methods, and interpreting results. Users should be able to inspect each, even if all three happen in one conversation.
“Completing the analysis” needs a clear delivery standard. We suggest including raw data and sources, formulas, key assumptions, interpretations under different definitions, and unresolved questions. This is a recommended way of working, rather than a capability automatically guaranteed by any model or data platform.
Data quality and data provenance
Data quality asks whether the data fits the task. Checks include missing fields, unusual values, consistent periods and units, and an update frequency appropriate to the question. Even apparently complete data may be unsuitable for comparison if its definitions differ.
Data provenance asks where data came from and how it was processed. A practical record retains the original source, retrieval time, reporting period, version or document identifier, and calculation and transformation steps. The fields available depend on what the source actually supplies. Mark missing information as “not provided” instead of inventing a plausible-looking source.
For example, if a data API returns “revenue: 120,” analysis still requires the company, reporting period, currency, and unit. If another record is a cumulative half-year value, the two cannot be used directly for a quarterly year-over-year comparison. Read these conditions alongside the numbers when checking data sources.
When sources disagree, a majority vote does not establish the correct value. They may share the same underlying dataset, or use different update times and statistical definitions. Return to the relevant original disclosure and record why the values differ.
Connecting data APIs through MCP: what does QVeris provide?
MCP, the Model Context Protocol, standardizes how AI applications connect to external systems, data, and tools. A data API typically provides a specific data service; MCP supplies the connection between a client and its tools. Together, they let an agent call capabilities needed for a task. MCP official introduction
QVeris provides access to professional data and tools, with natural-language capability discovery and execution through structured parameters. It helps agents find suitable services in the available catalog and reduces repeated integration work across providers. The website lists areas including finance and companies, social media, research, and patents; the selected service determines the actual coverage. QVeris website
| Capability | How it supports analysis | What to confirm before delivery |
|---|---|---|
| Discover | Find candidate tools and real tool_id values for a task | Does the tool description match the question? |
| Inspect | Check parameters, response contracts, and billing rules when needed | Do coverage, fields, and request conditions fit? |
| Probe | Check parameters or obtain a current quote when needed | Preflight does not run the data query or validate business conclusions |
| Call | Execute a selected service and retrieve results for the agent to analyze | Did it succeed? Is anything missing, truncated, or out of date? |
| MCP, CLI, API, and SDKs | Connect capabilities to existing AI clients or programs | Which connection method does the client support? |
The default path in the official documentation is Discover → Call. Add Inspect when more contract detail is needed, and Probe for parameter checks or a current quote. Discover and Inspect are free; data calls are charged according to each capability's billing rules. Documentation · Pricing
In this division of work, QVeris provides access to available data and tools, the agent organizes the analysis, and the user owns the objective and important judgments. Provider coverage, timeliness, and returned fields still need checking. Provenance, sensitivity analysis, and human review also need to be explicitly built into the workflow.
Claude Code data analysis: connect QVeris in four steps
This example uses Claude Code with remote MCP support. For other clients, select the relevant instructions on the QVeris connection page.
Step one: connect the data tools. Create an API key in the QVeris console and replace the local placeholder below following the official Hosted MCP instructions. Keep the real key in your own configuration, outside public articles and shared prompts. Reconnect and check the server status in /mcp. Hosted MCP setup
claude mcp add --transport http qveris https://mcp.qveris.ai/mcp --scope user --header "Authorization: Bearer YOUR_QVERIS_API_KEY"Step two: discover capabilities first. Check the connection with a clearly scoped request, such as: “Use QVeris to find tools for quarterly financial statements of U.S. public companies. Return the three best-matching tool_id values and their coverage. Do not execute any data calls yet.”
Step three: confirm scope and execution conditions. Check company identifiers, reporting periods, currencies, fields, and charges for the selected service. Use Probe if preflight is needed. A quote clarifies execution conditions; it does not lock the price or prove that the retrieved data will be correct. Probe documentation
Step four: execute, verify, and deliver. Once results arrive, check completeness, original disclosures, and calculations. Reading original files requires an available tool or manual review; do not assume that one API call contains all the evidence.
The prompt below can be given directly to a connected agent. It uses an instructional “propose first, execute after confirmation” flow so users can understand scope and costs.
A prompt for your connected agent
Use QVeris to verify revenue and net income for NVIDIA's latest disclosed quarter. Its SEC CIK is 0001045810.
First discover suitable SEC data tools and check their parameters, coverage, and billing rules. Use Probe if a current quote is needed. Return the plan and fee information first, and wait for my confirmation before executing.
Identify the latest disclosed three-month period and check the fiscal year, currency, units, and original 10-Q. Do not treat cumulative values as single-quarter figures or select an earlier period merely because its amendment date is newer.
Report the period, values, filing date, and original filing links. Clearly flag missing fields, failed requests, or truncated results; do not fill gaps with estimates.
Before calculating year-over-year changes, confirm comparable periods and metric definitions. Present raw facts, formulas, alternative interpretations, and the judgments I need to make separately.
This task follows the financial statement verification example on the website. It is an operating guide, not a live financial query or a claim about a customer's measured results.
Financial statement example: does 20% revenue growth mean performance improved?
Suppose fictional Company A's revenue rises from CNY 1 million to CNY 1.2 million, while net income falls from CNY 100,000 to CNY 90,000. The comparison uses the current quarter and the same quarter a year earlier under consistent accounting definitions. All figures are for teaching purposes.
| Metric | Same quarter last year | Current quarter | Change |
|---|---|---|---|
| Revenue | CNY 1 million | CNY 1.2 million | Up 20% |
| Net income | CNY 100,000 | CNY 90,000 | Down 10% |
| Net profit margin | 10% | 7.5% | Down 2.5 percentage points |
Revenue growth is calculated as “current-period revenue ÷ prior-year comparable revenue − 1.” Net profit margin is “net income ÷ revenue.” Revenue can grow while profitability declines. An agent should show both facts and explain whether available information on costs, one-off items, and other factors is sufficient to account for the change.
If the question is whether market scale expanded, revenue may be a useful clue. If the question is whether growth became more profitable, profit and related costs require further examination. The user should define the evaluation objective. QVeris can help retrieve data; choosing the objective and interpreting business performance remain analytical work.
Use a structure like this so readers can trace a judgment back to its evidence:
| Result layer | What to present |
|---|---|
| Raw facts | Values, periods, currencies, units, source links, retrieval times, and missing information |
| Calculations | Formulas, comparison baselines, and data transformations |
| Interpretation | Evidence supporting each interpretation and alternative explanations |
| Human judgment | The chosen evaluation objective, the reasoning behind it, and unresolved questions |
Human oversight: put people into the decisions that matter
Human oversight means people supervising a system's process and results. Here, human in the loop means involving a person at defined steps, such as confirming objectives, reviewing key assumptions, and deciding whether to continue. Its effectiveness depends on whether people see enough information and have an opportunity to change the analytical path.
Before analysis, define the objective. Break “Is performance good?” into concrete questions and specify acceptable metrics, samples, and comparison scope. An agent can suggest alternatives, but should not present a default definition as the only reasonable answer.
When selecting methods, compare outcomes. If weights, samples, or time windows change the result, ask the agent to show those differences and explain the chosen approach. Simply asking it to “check again” may not expose the most consequential assumptions.
When delivering conclusions, retain the reasoning. State which conclusions follow directly from data, which depend on interpretation, and where gaps remain. When more than one answer is reasonable, human judgment can be expressed through explicit objectives and tradeoffs.
These are design principles we recommend. Anthropic's study did not prove that these workflows eliminate bias, and QVeris does not equate data access with a guarantee of independent judgment.
Analyzing discussions on X: from searches to reviewable samples
The same approach applies to a brand team's data analytics work. To explore how people view the influence of AI agents on expert judgment, start with searches like these:
Anthropic "AI agents" judgment
"Claude Code" ("data analysis" OR analytics)
"AI agents" ("human judgment" OR "human oversight")
"AI agents" ("human oversight" OR "human in the loop")
"AI agents" ("data quality" OR "data provenance")
MCP ("data API" OR "data APIs" OR "data sources")
from:AlexTamkin since:2026-10-27
These are examples for finding discussions on X. The from: and since: operators restrict author and date; adjust them to your research scope. Use “Top” to explore widely circulated views and “Latest” to find recent discussion. See the X search guide.
To have an agent collect and organize data, first discover appropriate social-media capabilities through QVeris. Then check whether they currently support X, time filters, pagination, and engagement fields. Execute only after confirming support, and record coverage gaps when no suitable capability is available. The website lists social-media services, but that does not establish support for every query.
Set the time range, language, and topic before analysis, deduplicate by post ID, and distinguish original posts from reposts. Post counts describe the distribution of discussion; engagement counts describe circulation. These answer different questions. Likes and views reflect interactions at a particular time and do not represent universal agreement.
The final report should include original post links, collection times, filters, and reasons for each classification. Phrase conclusions as “within this visible sample” and retain differing views. This can help a team identify questions worth responding to without misrepresenting popular posts as industry consensus.
FAQ: AI data analysis, MCP, and professional data access
Can Claude Code be used for data analysis?
Yes. Professional analysts used Claude Code for analytical tasks in the cited study. What a particular workflow can accomplish still depends on available data, tool permissions, methods, and review requirements.
How does MCP differ from data APIs?
MCP standardizes how AI applications connect to external tools; data APIs provide specific interfaces for accessing data. QVeris Hosted MCP connects available platform capabilities to compatible clients. Developers can also use an API or SDK.
Why can accurate data still affect human judgment?
Metrics, samples, weights, and comparison scope all influence interpretation. Accurate numbers solve only part of the problem; the business question they are meant to answer must also be explicit.
Does QVeris automatically guarantee data quality and data provenance?
No. QVeris provides capability discovery and execution. Data quality and source information must be checked against actual service responses. Recording transformations, explaining missing information, and reviewing original sources belong in the analysis workflow.
Must every task run Discover, Inspect, Probe, and Call?
No. The default path is to discover and then call. Add Inspect when tool selection or request construction needs more detail, and Probe when parameter preflight or a current quote is needed. Fresh data requires a current query; an old result must not be passed off as live data.
How can I start a manageable agentic analytics task?
Choose a task with a verifiable answer, such as checking two fields for one company and one quarter, with clear period, unit, and source requirements. Complete retrieval and human review once before expanding to more metrics or sources.
Start with one verifiable data task
Connect your usual AI to data tools, begin with free capability discovery, and then make calls within the agreed scope. Start with two financial statement fields and see whether the agent clearly explains the values, periods, sources, and remaining judgments.
Connect your AI and find data capabilities for your task · Read the QVeris documentation
This article draws on materials accessible as of October 28, 2026. Company A is a fictional teaching example. The NVIDIA and X sections demonstrate workflows and do not claim completed live queries. QVeris recommendations are distinguished from Anthropic's research findings.
Primary sources: Anthropic research, Alex Tamkin's post, MCP official introduction, QVeris documentation, Hosted MCP instructions, and Probe documentation.
Try this workflow in Playground
Open a prefilled NVIDIA financial verification task. Review the prompt and send it when you are ready.