Turn business questions into live data calls, structured analysis, charts, and decision-ready reports through one capability routing layer.
Business intelligence changes constantly. Revenue changes, competitors launch, markets move, customers churn, inventory shifts, and news changes the context. A BI agent that relies only on model memory or static dashboards is answering yesterday's questions — not today's.
Business questions rarely live in one system. A simple question such as "Why did sales slow down this week?" may require CRM data, order data, spreadsheet exports, market signals, news context, and visual reporting. Without access to the right capabilities, an AI agent can only guess.
QVeris gives BI agents a unified capability routing layer to discover, inspect, and call the right business data, market signals, analysis tools, and reporting capabilities — without hardcoding every data source.
Natural-language access to live data is valuable only when business terms have stable definitions. “Revenue last month” may mean bookings, invoiced revenue, recognized revenue, gross or net value, local or reporting currency, and calendar or fiscal month.
Metric, population, period, comparison, dimensions, sort, limit, requested format, identity, and permitted scope.
Business definition, formula, unit, grain, valid dimensions, exclusions, owner, certification, effective date, and version.
Certified models, safe joins, row policy, parameterized filters, read-only credentials, cost limits, and reproducible query ID.
Result, definition, filters, cutoff, freshness, comparison method, lineage, caveats, and next review step.
只有业务术语拥有稳定定义时,自然语言访问实时数据才真正有价值。“上个月收入”可能指订单额、开票收入、确认收入、总额或净额、本地币或报告币、自然月或财务月。
指标、对象、期间、比较、维度、排序、上限、输出格式、用户身份与允许访问范围。
业务定义、公式、单位、粒度、可用维度、排除项、负责人、认证状态、生效日期与版本。
认证模型、安全 join、行级权限、参数化筛选、只读凭据、成本限制与可复现查询 ID。
结果、定义、筛选、截止时间、时效、比较方法、血缘、限制与下一步复核。
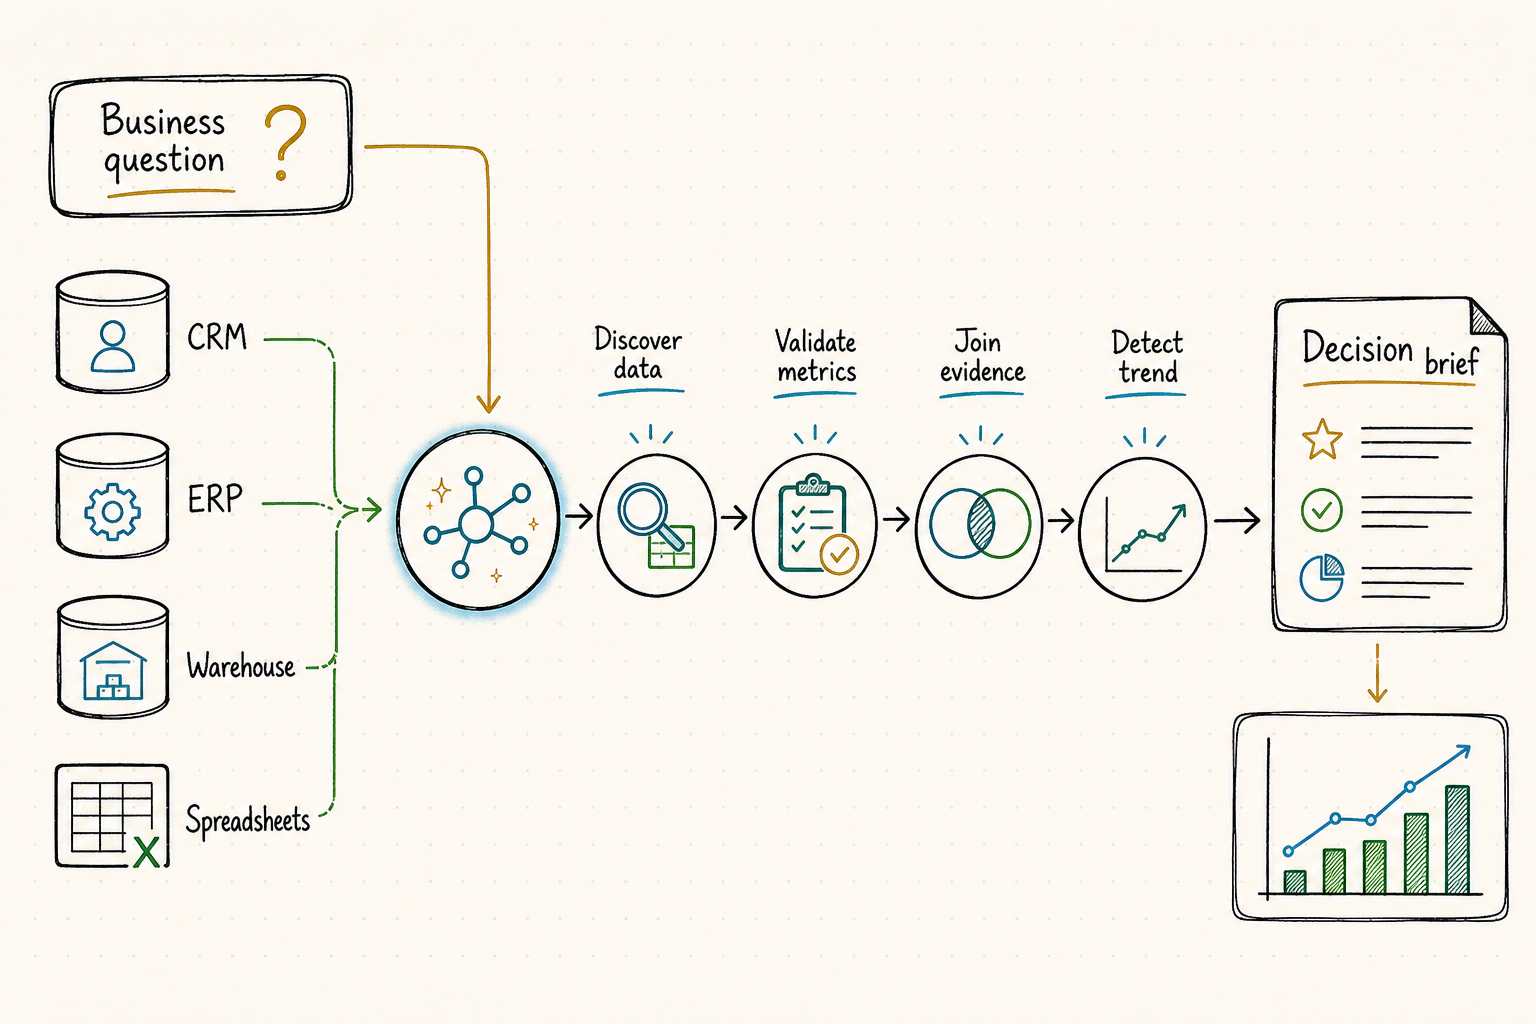
Five layers of capabilities a business intelligence agent needs to go from question to decision-ready output.
The agent searches QVeris for the right capability based on the business question — CRM data, market signals, news, charting, or reporting tools.
The agent checks inputs, outputs, cost, latency, and examples before calling. No blind calls to unknown data sources or analysis tools.
The agent executes the selected capability and receives structured output — revenue figures, market context, competitor signals, or chart data.
The agent combines data from multiple sources into a coherent analysis — cross-referencing internal metrics with external signals.
The agent generates an executive-ready summary, chart, or workflow output with recommended next actions.
How a BI agent uses QVeris to go from "Why did revenue drop?" to an executive decision brief.
Pull weekly revenue by region, compare EMEA against previous weeks, segment by product, channel, and customer type through connected data capabilities.
Check relevant market and industry news through external signal capabilities. Pull competitor updates if available through market intelligence tools.
Generate a chart showing the trend using chart generation capabilities. Summarize likely drivers from the combined data.
Suggest follow-up questions and next actions. Generate an executive-ready decision brief for human review.
EMEA revenue declined 12.4% week over week, driven primarily by lower enterprise renewals and weaker conversion in paid acquisition channels.
This is an illustrative example of BI agent output. It does not represent real company data, financial results, or guaranteed business analysis. All outputs should be reviewed by qualified humans before business decisions.
A syntactically valid query can still answer the wrong business question, leak restricted rows, double-count a many-to-many join, or scan an unreasonable amount of data. The agent should prepare an inspectable plan before execution.
Resolved user, organization, row and column entitlements, purpose, export policy, and whether small-group or personal data restrictions apply.
Certified metric version, formula, unit, fiscal calendar, entity population, grouping grain, aggregation behavior, and treatment of nulls or slowly changing dimensions.
Governed models, approved join path, key cardinality, effective dates, data cutoff, and checks that prevent fan-out or incompatible grains.
Parameterized filters, partitions, time window, row limit, dry-run scan estimate, timeout, cancellation, and whether a narrower question is required.
Expected row count, uniqueness, missingness, units, subtotal relationships, comparison coverage, and reference totals used for reconciliation.
语法正确的查询仍可能回答错误问题、泄露受限数据、因多对多 join 重复计算,或扫描不合理的数据量。Agent 应在执行前生成可供检查的查询计划。
已解析用户、组织、行列权限、使用目的、导出政策,以及是否适用小群体或个人数据限制。
认证指标版本、公式、单位、财务日历、实体范围、分组粒度、聚合行为,以及空值和缓慢变化维度的处理方式。
治理模型、批准的 join 路径、键基数、生效日期、数据截止时间,以及防止 fan-out 和粒度不兼容的检查。
参数化筛选、分区、时间窗、行数限制、dry-run 扫描预估、超时、取消,以及是否必须缩小问题范围。
预期行数、唯一性、缺失、单位、小计关系、比较覆盖,以及用于对账的参考总额。
Six business intelligence workflows powered by QVeris capabilities.
Generate daily or weekly executive summaries with live data, trend charts, and variance explanations — not static screenshots.
Analyze revenue movements by region, product, channel, and segment. Cross-reference with external market signals for context.
Monitor competitor updates, pricing changes, product launches, and market positioning through discoverable research capabilities.
Track industry trends, macro indicators, regulatory changes, and sector movements that impact business performance.
Segment churn data, identify at-risk accounts, and cross-reference with product usage, support tickets, and NPS signals.
Turn structured data and analysis into presentation-ready summaries, charts, and narrative briefs for stakeholders.
Dashboards show what happened. BI agents should help explain what happened, fetch the missing context, and recommend what to do next.
| Requirement | Static dashboards | QVeris-powered BI agent |
|---|---|---|
| Data access | Predefined queries and fixed data sources | ✓Dynamic capability discovery based on the business question |
| Context | Limited to connected data sources | ✓Can pull external market signals, news, and competitor context |
| Analysis | Pre-built charts and reports | ✓Combines internal data with external signals for richer analysis |
| Explanation | Shows variance but does not explain why | ✓Generates structured explanations with potential drivers and recommendations |
| Adaptability | New questions require new dashboards | ✓Agents can discover new capabilities dynamically as questions evolve |
Multiple integration paths for production systems, data apps, and agent clients
A live connection does not guarantee current or complete data. If one model missed its refresh, the agent should label the answer partial and avoid period comparisons that pretend coverage is equal.
Retain source system, governed models, transformations, metric version, query ID, filters, and the report, chart, alert, or export destination.
Compare totals with certified dashboards, finance reports, control tables, or prior periods. Explain expected differences in timing, currency, entity scope, and accounting basis.
When a metric or model changes, identify affected saved questions, rerun tests, notify owners, and keep old answers tied to the definition that produced them.
A large decline can request an explanation; it should not automatically change a forecast, send a broad report, or update an operational system. Those remain separately authorized capabilities.
实时连接并不保证数据最新或完整。如果某个模型未按时刷新,Agent 应把答案标记为部分结果,并避免假装两个期间覆盖一致。
保留源系统、治理模型、转换、指标版本、查询 ID、筛选,以及报告、图表、告警或导出的目的地。
与认证仪表盘、财务报表、控制表或历史期间核对总额,并解释时间、币种、实体范围和会计口径的合理差异。
指标或模型变化时,识别受影响的已保存问题,重跑测试、通知负责人,并让历史答案继续关联当时使用的定义。
大幅下降可以触发解释请求,但不能自动修改预测、向更广范围发报告或写入业务系统;这些动作仍应单独授权。
How to instruct a BI agent to use QVeris for business intelligence workflows.
Developers building intelligent BI agents that need live data, external signals, and reporting capabilities beyond model context.
Teams moving from static dashboards to agent-driven analysis that explains variance, fetches context, and recommends actions.
Teams analyzing revenue movements, pipeline health, conversion trends, and churn signals with richer external context.
Teams needing structured competitive and market intelligence to inform positioning, pricing, and product decisions.
Teams building automated reporting workflows that combine internal financial data with market and industry context.
Teams building analytics copilots, reporting agents, or internal BI tools on top of existing data infrastructure.
Browse the complete catalog of AI agent tools and business data capabilities.
Discover top MCP platforms for BI, data, and reporting workflows.
Explore competitor monitoring and market analysis workflows.
Explore stock screening, company research, and financial data workflows.
Let your AI agent discover the right data, call the right capabilities, and generate decision-ready business intelligence.
Discover. Inspect. Call. Analyze. Report.
