
Comparable Company Analysis Template for AI Agents
Build AI agents that select peer groups, calculate valuation multiples, assemble comps tables, and produce source-backed valuation briefs for investment research.
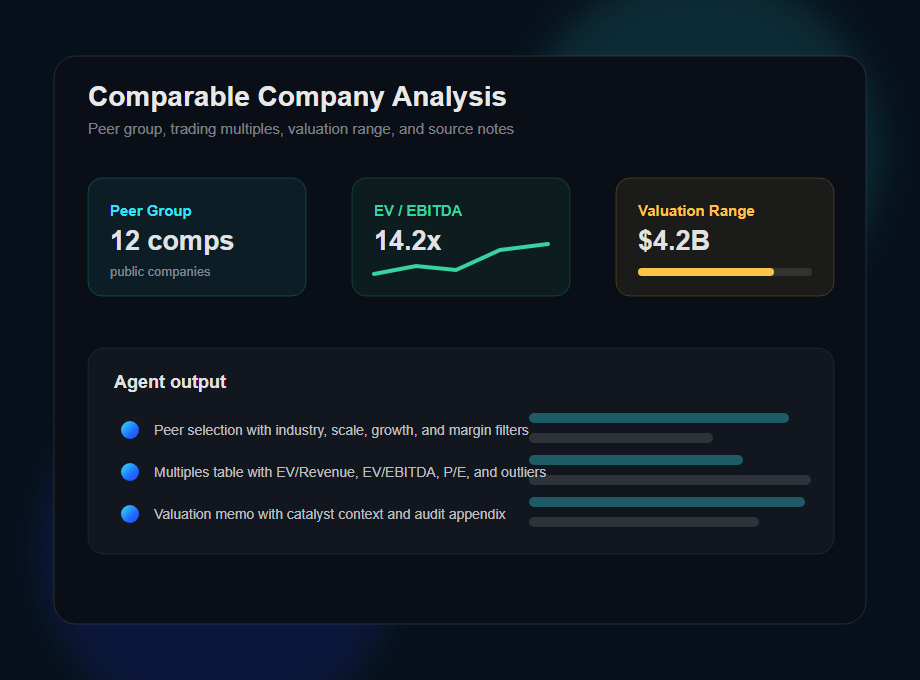
What Is Comparable Company Analysis?
Comparable company analysis, often called comps analysis or trading comps, is a valuation method that compares a target company with similar public companies. Analysts use peer multiples such as EV/Revenue, EV/EBITDA, EV/EBIT, P/E, and sector-specific ratios to estimate a valuation range.
This QVeris scenario targets the higher-traffic keyword comparable company analysis template, then supports comparable company analysis, comps analysis, and valuation multiples as secondary intents, then connects it to the QVeris Valuation Comps Builder skill. The workflow helps agents select peers, gather market and financial data, compute multiples, flag outliers, and generate source-backed valuation briefs.
What a Comparable Company Analysis Template Needs
A useful comparable company analysis template does more than list peers. It checks multiples, outliers, context, sources, and agent-ready outputs.
Peer Group Selection
Select comparable public companies by business model, geography, revenue scale, growth, margin profile, and listing status.
Market Data Collection
Gather share price, market cap, net debt, enterprise value, and other market inputs needed for trading comps.
Financial Metric Mapping
Collect revenue, EBITDA, EBIT, earnings, growth, margin, leverage, and balance-sheet context for each peer.
Valuation Multiple Calculation
Calculate EV/Revenue, EV/EBITDA, EV/EBIT, P/E, P/S, and sector-specific multiples with consistent definitions.
Outlier and Catalyst Review
Flag unusual multiples, missing values, one-time events, earnings catalysts, and company-specific distortions.
Valuation Brief Output
Return a comps table, median and mean multiples, implied valuation range, analyst notes, and source appendix.
How QVeris Routes Valuation Comps Workflows
QVeris keeps the valuation process agent-native: discover financial capabilities, inspect schemas, call the skill, then return structured comps output.
// Example valuation comps agent task
goal: "Build a public comps table for a target company"
discover: company profile, market data, peer group, financial metrics
inspect: multiple definitions, period basis, source freshness, output schema
call: "https://qveris.ai/skills/qveris-valuation-comps-builder"
output: peer table, multiples, outliers, valuation range, source notes
Where Comparable Company Analysis Fits
The same workflow can support investment banking, equity research, corporate development, and private-market analysis.
Investment Banking Valuation
Build trading comps tables for pitch books, valuation sections, fairness analysis, and transaction support.
Equity Research Notes
Compare a company against public peers using growth, profitability, balance sheet, and valuation multiple context.
Corporate Development Screens
Benchmark potential targets, market positioning, and valuation ranges before deeper diligence.
QVeris Valuation Comps Builder Skill
Use the actual QVeris skill for peer comps, valuation multiples, catalyst context, analyst memo output, and audit appendix.
Static Template vs QVeris Comps Workflow
| Need | Static comps template | QVeris valuation workflow |
|---|---|---|
| Select peers | Analyst manually copies a peer list | Agent discovers and reviews peer candidates with context |
| Gather market data | Manual exports and spreadsheet cleanup | Calls relevant market and company data capabilities |
| Calculate multiples | Formula-driven but source quality varies | Returns structured multiples with source and definition notes |
| Prepare memo | Manual write-up after table creation | Generates comps table, valuation range, catalyst notes, and audit appendix |
Useful Comparable Company Analysis References
External references help readers understand comps analysis, valuation multiples, and investment-banking valuation workflows.
CFI Comparable Company Analysis
Reference guide covering comps analysis, public comparables, and valuation multiple interpretation.
Wall Street Prep Comps Guide
Investment-banking oriented explanation of trading comps and peer valuation methods.
Investopedia Comps Overview
Introductory explanation of comparables, valuation context, and public-market benchmarking.
Comparable Company Analysis FAQ
What is comparable company analysis?
How do you build a comps table?
What multiples are used in comps analysis?
Which QVeris skill does this scenario map to?
Build a Valuation Comps Agent
Use QVeris to route valuation questions to peer, market data, financial metric, and catalyst capabilities, then generate source-backed comps briefs.