Executive Dashboard with AI Daily Briefings
Build a leadership dashboard that does more than display charts: it turns revenue, cash, product, customer, market, and risk signals into a daily executive briefing.
What Is an Executive Dashboard?
An executive dashboard is a leadership view of the metrics and signals that matter most: revenue, pipeline, cash, product health, customer risk, team execution, market movement, and operational incidents. The problem is that dashboards often show data without explaining what changed or what needs attention today.
This QVeris scenario turns the Chairman daily report skill into a broader search-friendly page: an executive dashboard enhanced by AI daily briefings. The agent does not just render charts. It discovers relevant capabilities, inspects their schemas, calls fresh business signals, and writes a leadership-ready brief.
What an AI Executive Dashboard Should Track
Traffic-focused keywords work best when the page answers the broad dashboard intent and then shows a more useful AI workflow.
Revenue and Pipeline
Track revenue movement, bookings, churn, renewals, sales pipeline changes, forecast risk, and enterprise deal slippage.
Cash and Finance
Summarize cash runway, burn rate, collections, margin changes, budget variance, and finance items that need executive attention.
Product and Engineering
Highlight incidents, usage changes, adoption signals, delivery risk, roadmap movement, and customer-impacting product issues.
Customers and Support
Identify account risk, support spikes, response delays, escalations, NPS changes, and customer themes leadership should see early.
Market and Competitors
Surface pricing changes, product launches, funding events, market news, category demand signals, and competitive positioning shifts.
Risks and Decisions
Convert scattered data into a short list of risks, opportunities, anomalies, and decisions for the CEO, founder, or chairman.
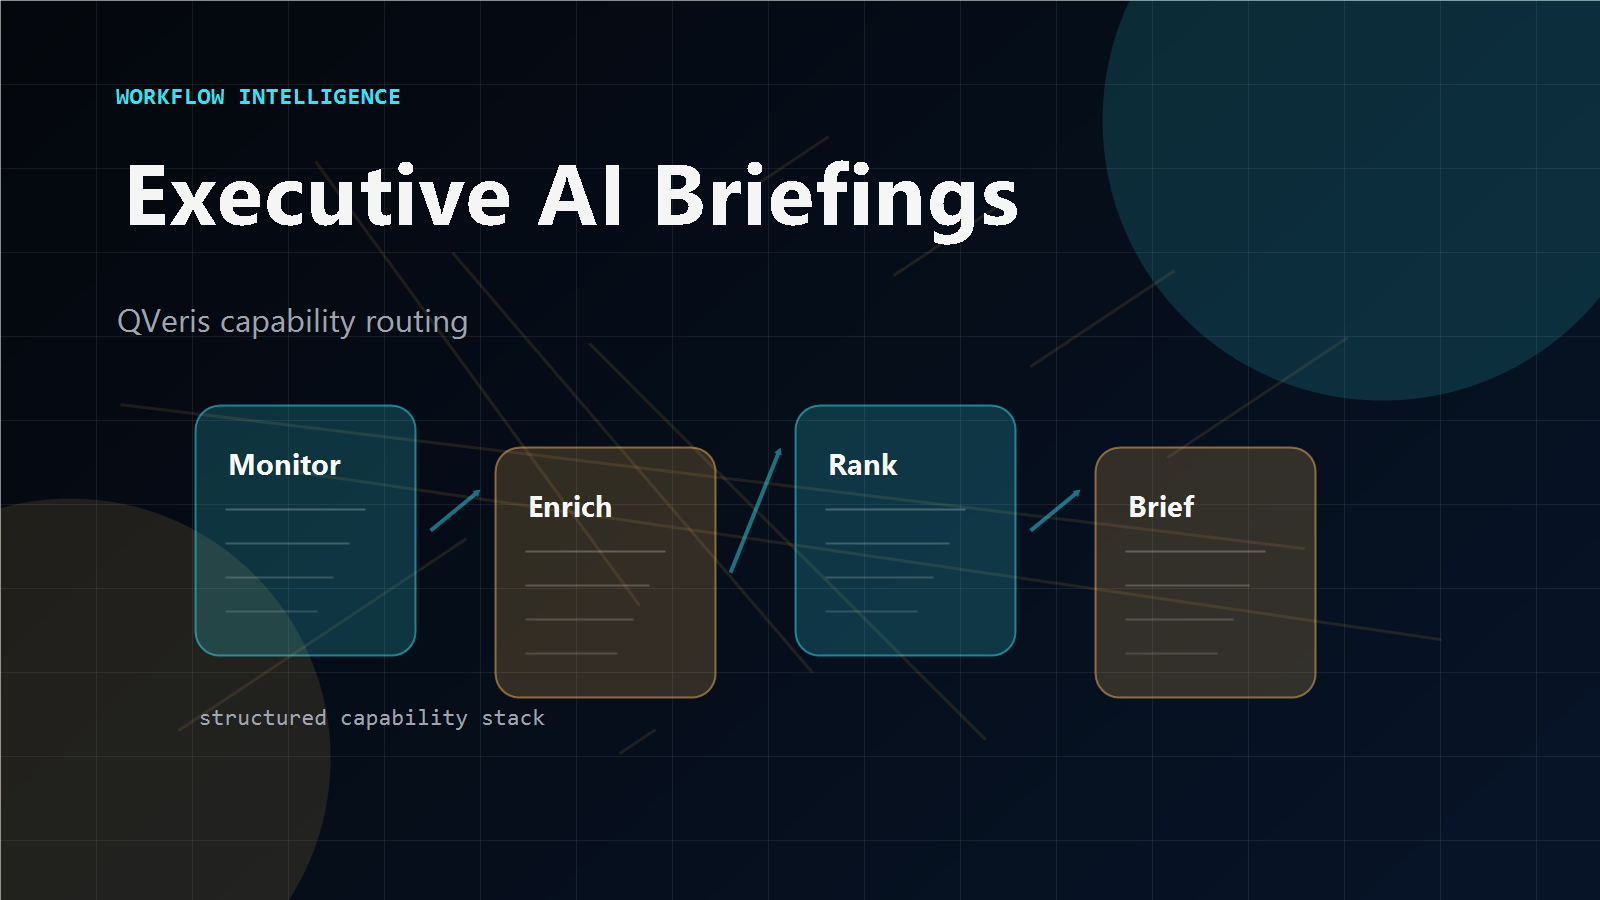
How QVeris Creates an AI Daily Business Briefing
The QVeris pattern gives the agent a disciplined route from leadership question to structured executive report.
// Example executive briefing agent task
goal: "Generate today's CEO dashboard brief"
discover: revenue, cash, support, product, market, risk capabilities
inspect: required inputs, freshness, output schema, cost
call: selected business and market capabilities through QVeris
output: KPI changes, anomalies, risks, decisions, next actions
Executive Dashboard Scenarios You Can Build
These sections target real search intent while keeping the page tied to QVeris workflows.
CEO Daily Report
Create a concise daily report that combines revenue, cash, risk, product, and market context for a CEO or founder.
Founder Morning Briefing
Turn scattered business updates into a morning briefing with what changed, why it matters, and what to inspect next.
Leadership KPI Dashboard
Use AI to explain KPI movement rather than asking leaders to interpret every chart, table, and dashboard tile manually.
Chairman Daily Report
Map the QVeris skill to a broader executive reporting scenario for chairmen, board observers, and leadership teams.
Static Dashboard vs AI Daily Briefing
| Need | Static executive dashboard | QVeris AI daily briefing |
|---|---|---|
| Understand what changed | Leader reads charts manually | Agent summarizes KPI movement and anomalies |
| Pull context from many systems | Separate BI, CRM, finance, support, product, and market tools | Discover and call relevant capabilities through one workflow |
| Prioritize attention | Everything looks equally important | Risks, opportunities, and decisions are ranked for review |
| Prepare daily communication | Manual notes, screenshots, and status updates | Structured executive report generated from fresh signals |
Useful Executive Dashboard References
These external references support the broader executive dashboard and business intelligence topic.
Tableau Executive Dashboard Guide
Reference material on executive dashboard examples and leadership KPI reporting.
Klipfolio Business Dashboard Guide
Background on business dashboards, metrics, and reporting use cases.
Gartner Business Intelligence Definition
Context for BI as a decision-support layer for teams and executives.
Executive Dashboard FAQ
What is an executive dashboard?
What is an AI daily business briefing?
How is this different from a normal BI dashboard?
Which QVeris skill does this scenario map to?
Build an AI Executive Dashboard
Use QVeris to route executive questions to the right business capabilities and generate a daily briefing your leadership team can actually read.