
Free Macroeconomic Data API
Compare each free macroeconomic data API for GDP, inflation, rates, jobs, and trade—then build a reliable Python or agent workflow.
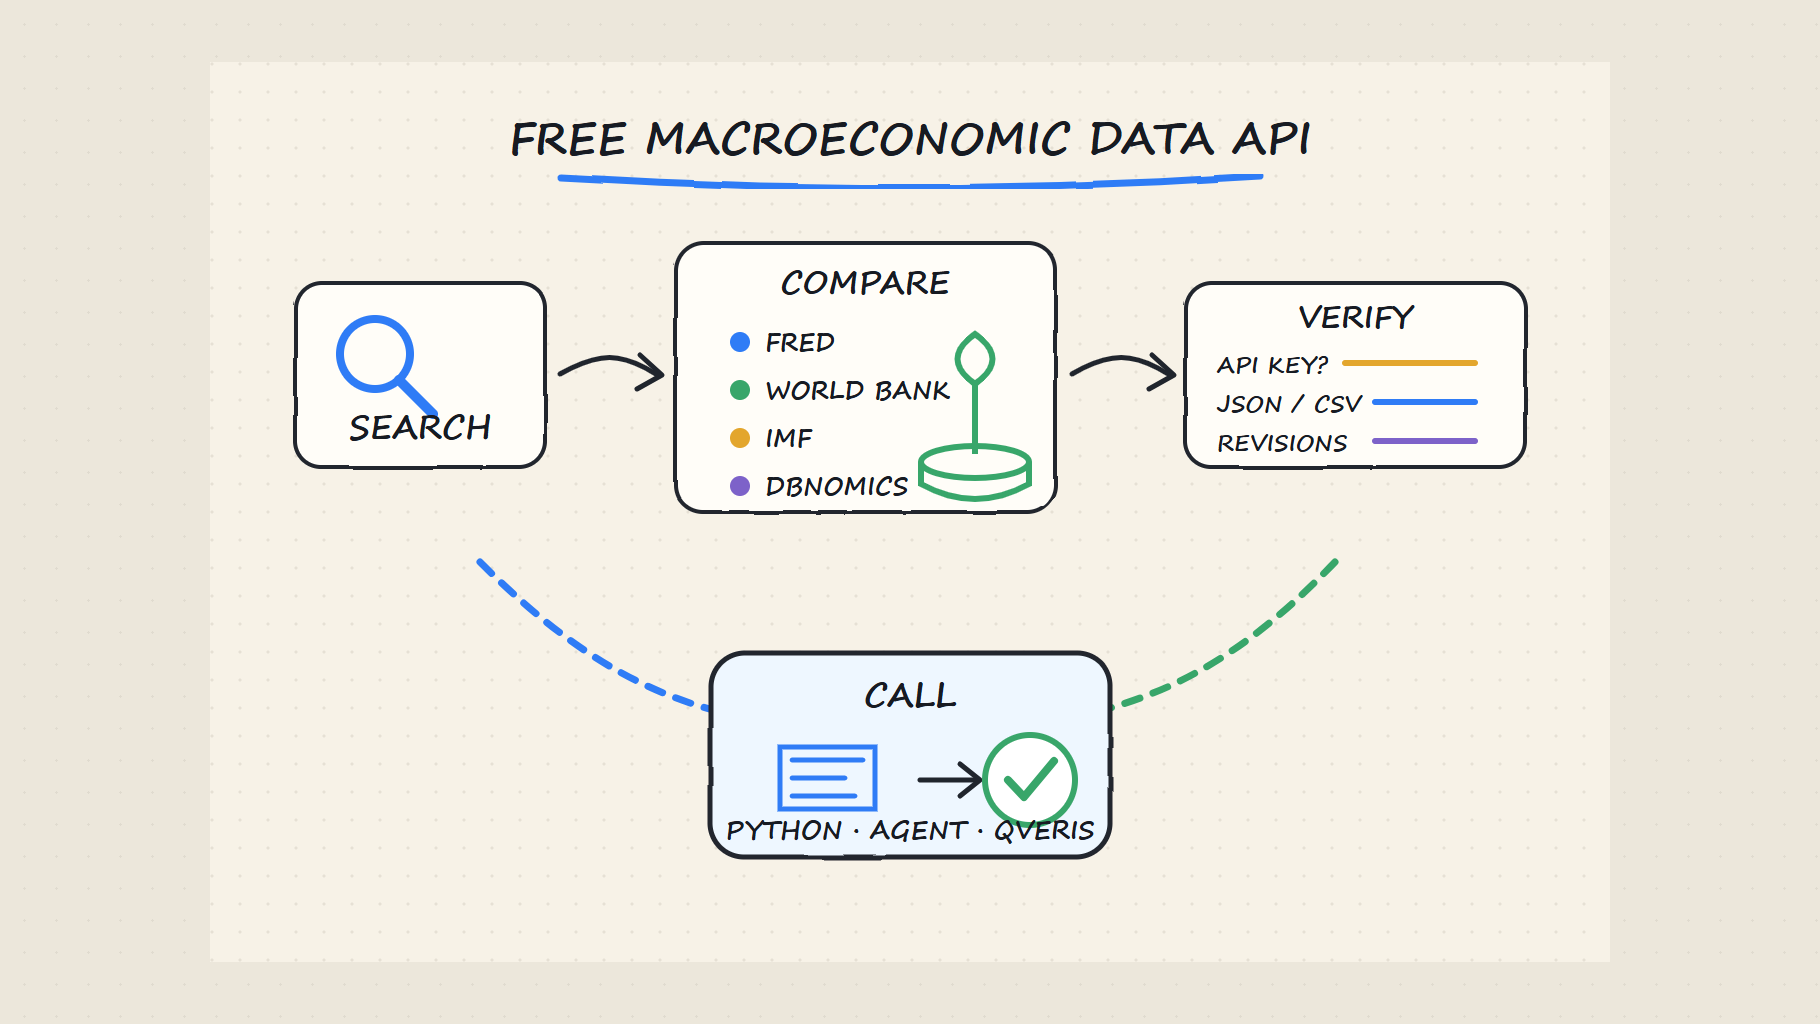
Free macroeconomic data API: quick answer
Use FRED for deep US coverage, World Bank or IMF for cross-country indicators, Eurostat for EU data, and DBnomics to search across providers.
Authentication, coverage, formats, rate limits, licensing, update schedules, and revision history vary by source.
Check units, frequency, seasonal adjustment, geography, release date, missing values, and whether observations may be revised.
QVeris helps agents and developers discover and inspect relevant data capabilities before calling the provider that fits the task.
What users need from a macroeconomic data API
Searchers usually want a usable economic data API free enough for a prototype, notebook, dashboard, or AI agent. The recurring need is not merely “find GDP.” It is to identify a trustworthy series, retrieve it programmatically, understand its metadata, and keep the integration stable when values are missing or revised.
Entities and features repeated across current results
FRED, World Bank, IMF, Eurostat, OECD, national statistics offices, and DBnomics appear repeatedly because each covers a different geography or discovery need.
GDP, CPI and inflation, unemployment, policy rates, exchange rates, industrial production, population, and trade are the dominant entities.
REST endpoints, JSON or CSV output, API keys, Python examples, pagination, date filters, metadata, licensing, and rate limits shape the engineering choice.
Units, frequency, seasonal adjustment, source provenance, publication timestamps, revisions, and missing observations determine whether a series is safe to compare.
Define the macroeconomic dataset before selecting an API
A macroeconomic data API should connect a clearly defined indicator to a geography and statistical period. It is not simply a stream of numbers tagged “GDP” or “inflation.” The useful record includes the indicator concept, country or region, unit, price basis, frequency, seasonal-adjustment status, observation period, release or update time, source institution, and revision status. This page focuses on building comparable country-level macro time series. The broader free economic data API guide is better when the task is first choosing among many economic-data categories.
| Indicator family | Common variants | Required metadata | Frequent comparison error |
|---|---|---|---|
| GDP | Nominal, real, level, growth, annual, quarterly, total, per capita. | Currency, base year, price basis, seasonality, annualization. | Comparing current-price levels with constant-price growth. |
| Inflation | CPI index, month-over-month, year-over-year, headline, core, GDP deflator. | Index base, basket, adjustment, transformation, reference period. | Treating an index level as an inflation rate. |
| Labor | Unemployment rate, employment, payrolls, participation, vacancies. | Population scope, age band, survey, adjustment, person count or rate. | Mixing survey populations or adjusted and unadjusted data. |
| Rates and money | Policy target, effective overnight rate, lending rate, money supply. | Instrument, maturity, counterparty, stock or flow, observation time. | Calling every interest-rate series a policy rate. |
| Trade and external | Exports, imports, balance, current account, FX reserves, FDI. | Currency, valuation, partner, seasonality, flow direction, period. | Mixing nominal values, volume indexes, and percent of GDP. |
Compare free macro data API sources
| Source | Best fit | Key / format | Important caveat |
|---|---|---|---|
| FRED | Deep US and selected global economic time series. | Free key; JSON/XML. | Series definitions and revisions must be checked. |
| World Bank | Cross-country development and macro indicators. | No key; JSON/XML. | Many series are annual and can lag releases. |
| IMF DataMapper | Global macro indicators and WEO-style comparisons. | No key; JSON. | Coverage differs by indicator and economy. |
| OECD Data Explorer | Detailed harmonized indicators for OECD members and partner economies. | Free SDMX API; CSV, JSON, or XML. | Use the query builder and preserve every selected dimension. |
| Eurostat | Official EU statistics and detailed dimensions. | No key; JSON-stat/SDMX. | Dimension codes require careful handling. |
| DBnomics | Discovery across many official providers. | No key; JSON. | Keep the original provider and series metadata. |
How to use a macroeconomic data API in Python
A revision-aware workflow for GDP and inflation data APIs
Write down indicator, geography, unit, frequency, seasonal adjustment, price basis, and required history before choosing a provider.
Resolve the provider’s indicator and country codes, then save the title, source, unit, frequency, and update notes with the series ID.
Use a narrow date range first. Confirm status, schema, null handling, pagination, ordering, and whether dates represent periods or publication timestamps.
Cache responsibly, retry transient failures, preserve raw responses, and record retrieval time. Do not overwrite earlier values when revision history matters.
Working Python example: compare World Bank GDP growth
The World Bank Indicators API v2 does not require an API key. This example requests annual real GDP growth for the United States and China, validates the two-part JSON response, rejects missing observations, and preserves the indicator code and source. It is intentionally annual cross-country data; it should not be mixed with quarterly seasonally adjusted GDP without an explicit transformation.
import requests

url = (
    "https://api.worldbank.org/v2/country/USA;CHN/"
    "indicator/NY.GDP.MKTP.KD.ZG"
)
params = {
    "date": "2019:2025",
    "format": "json",
    "per_page": 100,
}

response = requests.get(url, params=params, timeout=30)
response.raise_for_status()
payload = response.json()

if not isinstance(payload, list) or len(payload) != 2:
    raise ValueError("Unexpected World Bank response shape")

page, observations = payload
rows = []
for item in observations:
    if item.get("value") is None:
        continue
    rows.append({
        "country_code": item["countryiso3code"],
        "period": int(item["date"]),
        "indicator_code": item["indicator"]["id"],
        "real_gdp_growth_percent": float(item["value"]),
        "source": "World Bank Indicators API v2",
    })

assert rows, "No non-null GDP observations returned"
print(sorted(rows, key=lambda row: (row["country_code"], row["period"]))[-4:])
Normalize macroeconomic data without erasing meaning
Use a long-form observation schema
A durable record separates identity from value. Store provider, dataset, indicator code, country or region code, frequency, observation period, value, unit, multiplier, seasonal adjustment, price basis, transformation, status flag, release time, retrieval time, and source URL. Preserve the provider’s original codes next to normalized labels. A friendly name such as “GDP growth” is not a stable key because several series can share it. Country aggregates also need their own entity type; “Euro area,” “World,” and “High income” are not countries even if an API returns them through a country-shaped endpoint.
Do not compare values until units and periods match
Convert only when the transformation is mathematically and statistically justified. Current local currency, current U.S. dollars, constant-price national currency, PPP dollars, index levels, annual percentage change, and percent of GDP answer different questions. Quarterly GDP growth can be quarter-over-quarter, annualized quarter-over-quarter, or year-over-year. Monthly inflation can be an index, monthly change, or annual change. Keep the raw value and unit, store the normalized value in a separate field, and record the formula. Never infer seasonal adjustment from frequency alone.
Make cross-country macroeconomic comparisons defensible
Choose a comparison basis that matches the question
Country comparisons fail when a technically valid number answers the wrong question. Nominal GDP converted at market exchange rates is useful for measuring current-dollar economic size, while purchasing-power-parity GDP addresses a different comparison of domestic purchasing power. Real GDP growth is suited to change over time, but its chain-linked level is not always additive across components or directly comparable in currency terms. GDP per capita changes the denominator again. Write the intended statement first—size, growth, living-standard proxy, fiscal burden, trade exposure, or cyclical momentum—then select the indicator and denominator that support it.
Align geography, period, frequency, and release status
Use one geographic classification and preserve changes such as country splits, code changes, and regional membership. Align all economies to a common statistical period instead of taking each country’s latest non-null value from a different year. When converting quarterly observations to annual values, define whether to sum flows, average rates, or take end-of-period stocks; one aggregation rule does not work for every series. Display coverage counts and missing economies. If one country’s value is an official observation and another’s is an estimate or forecast, keep that status visible rather than ranking them as equivalent facts.
Minimum comparison key: indicator definition + geography type + period + frequency + unit + price basis + seasonal adjustment + transformation + release status. If one component differs, explain or reject the comparison.
Handle releases, revisions, vintages, and forecasts explicitly
Observation period is not publication time
A GDP value labeled 2025 may be published in 2026 and revised several times afterward. Store the statistical period, first release time, latest update time, retrieval time, and—when available—vintage or revision identifier separately. For event-driven dashboards, consult the official release calendar instead of polling continuously. For backtests, use the value available to the strategy at the historical decision time; loading today’s revised history into yesterday’s model creates look-ahead bias.
Separate actual observations from estimates and forecasts
International datasets may combine reported observations, staff estimates, projections, and modeled values. Preserve status flags and forecast horizons. Do not append projections to actual history without a field that distinguishes them. A missing value is not zero, and “latest available” may refer to different years across countries. Cross-country rankings should either align to one common period or clearly display each economy’s observation year and coverage gap.
Build a production macroeconomic data pipeline
Separate discovery, retrieval, validation, and delivery
Discovery maps a user request to a provider, dataset, indicator, geography, frequency, and unit. Retrieval follows the provider’s documented pagination and stores the raw response. Validation checks schema, duplicates, nulls, period ordering, units, status flags, and coverage. Normalization creates an internal observation model without destroying source fields. Delivery exposes approved records to a dashboard, notebook, database, API, or agent. This separation makes it possible to reprocess history after a parser or mapping rule changes.
Respect pagination, rate limits, and release schedules
The World Bank response includes page metadata; never assume the default page contains every country or period. OECD’s SDMX service is free but rate limited and recommends focused queries. Cache immutable historical partitions, refresh only periods that can still change, and use bounded retries with backoff for temporary failures. Do not retry invalid indicator codes or permission errors indefinitely. Alert on stale latest periods, disappearing series, sudden null-rate increases, unexpected unit changes, and country coverage dropping below an agreed threshold.
Design the API workflow around the macroeconomic use case
Dashboards and research notebooks
A public dashboard needs readable definitions, observation periods, latest-update labels, revision notes, units, source links, and graceful treatment of missing countries. A research notebook additionally needs deterministic query parameters, raw-response snapshots, code version, and transformation formulas so results can be reproduced. Precompute common transformations such as year-over-year growth only when the source series and frequency are stable; otherwise calculate them in a versioned research layer and retain the source level.
Alerts, nowcasting, and AI agents
A release alert should trigger from the official calendar or a verified new release identifier, not merely from a changed “latest” value that could be a revision. A nowcasting model needs an as-of dataset that records what was available on every model date, including publication lags and revisions. For an AI agent, expose narrow operations such as “retrieve one indicator for named countries and periods,” “search indicator metadata,” or “compare values only after compatibility checks.” Require explicit codes or resolved metadata, cap default result size, and return provider, series, unit, period, status, and retrieval time with every answer.
QVeris can help discover and inspect these operations and route an agent to a suitable capability. It should not hide whether a value came from the World Bank, IMF, OECD, Eurostat, FRED, or another producer. The agent’s interpretation must remain separate from retrieved facts, and high-impact claims should link back to the original statistical definition and release.
How QVeris helps discover economic data APIs
QVeris does not change a provider’s data or promise broader coverage. It helps developers and agents search for relevant capabilities, inspect their documented inputs and outputs, and connect the chosen tool to a workflow. Review the QVeris Finance provider details, then confirm the original statistical provider documentation before production use.
- Search by task and indicator instead of guessing a provider name.
- Inspect authentication, required parameters, response shape, and documented limits.
- Keep the original provider, series code, unit, and retrieval timestamp in downstream output.
FAQ
No single API wins every use case. FRED is strong for US time series, World Bank and IMF for international indicators, Eurostat for EU statistics, and DBnomics for cross-provider discovery.
World Bank, IMF DataMapper, Eurostat, and DBnomics can be queried without a key. Recheck current policies, fair-use guidance, and limits before production deployment.
Use requests or a maintained client, begin with metadata and a small date range, validate units and dates, then add caching, retries, provenance, and revision-aware storage.
Yes. FRED API access is free, while most requests require a free API key. See the dedicated free FRED data API guide.
No. The current v2 Indicators API can be queried without an API key. Use the v2 path, request JSON explicitly, and follow pagination metadata.
Only after indicator concept, price basis, currency, frequency, seasonal adjustment, transformation, period, and revision status match.
A vintage represents the observations available at a particular historical time. It helps prevent revised data from leaking into point-in-time backtests.
No. QVeris helps agents discover and call capabilities; the original institution remains authoritative for definitions, values, revisions, licensing, and release schedules.