
Free Technical Analysis API
for Indicators and Signals免费股票技术指标 API
选择、验证与接入指南
Find a free technical analysis API, compare indicators and limits, and integrate trustworthy market-analysis data into an app or agent.
寻找适合股票、加密货币或外汇的免费技术指标 API,
比较指标、周期、额度与响应结构,并安全接入应用或 Agent。
TL;DR概览
A free technical analysis API that returns usable indicator values without requiring local calculations from raw OHLCV bars.
Indicators, supported markets, intervals, history, free-plan limits, latency, licensing, and response fields.
Timestamped RSI, MACD, SMA, EMA, Bollinger Bands, ATR, ADX, stochastic, and related values.
QVeris helps agents discover technical-analysis capabilities, inspect their contracts, and call a selected tool.
找到能直接返回技术指标数值的免费接口,避免自行清洗 OHLCV 数据并重复实现指标公式。
指标范围、市场覆盖、时间周期、历史深度、免费额度、数据延迟、许可和响应字段。
带时间戳的 RSI、MACD、SMA、EMA、布林带、ATR、ADX 与随机指标等数据。
帮助 Agent 发现技术分析能力、检查工具契约,并按目标工具的公开条件发起调用。
What a free technical analysis API returns免费技术指标 API 会返回什么
A technical indicator API usually accepts a symbol, market or exchange, interval, indicator name, and calculation parameters. It returns one or more timestamped values derived from price and volume bars. A useful response also reveals parameter settings, ordering, null warm-up rows, and the underlying bar time.
技术指标 API 通常接收证券代码、市场或交易所、周期、指标名称和计算参数,再返回由价格与成交量 K 线计算的时间序列。可靠响应还应明确参数、排序方式、预热期空值及底层 K 线时间。
Technical indicators API
Look for RSI, MACD, moving averages, Bollinger Bands, ATR, ADX, stochastic oscillators, and any indicator-specific parameters your application needs.
Market and interval coverage
Confirm stocks, crypto, forex, ETFs, or indices separately. Check supported exchanges and whether daily, intraday, or real-time intervals require a paid entitlement.
Response schema and freshness
Inspect timestamps, timezone, numeric types, ascending or descending order, adjustment rules, and the documented data delay.
Free plan constraints
Check requests per minute and day, endpoint credits, historical depth, commercial-use rights, attribution, and whether indicator endpoints are included.
Snapshot, series, or interpreted signal
A latest-value endpoint answers a different question from a complete historical series. Some services also return labels such as overbought, crossover, or buy and sell. Treat those labels as provider interpretations: require the rule, threshold, confirmation window, and model version instead of assuming they are equivalent to raw indicators.
Formula and source-bar identity
Record smoothing method, initialization, price input, lookback, deviation convention, precision, and methodology version. Tie every result to the underlying bar provider, venue or exchange, session, timezone, interval boundary, candle status, and corporate-action adjustment so differences can be explained.
Pre-calculated API versus local library
Use an API when a few consistent indicators and low integration effort matter most. Prefer local calculation when you already have licensed OHLCV data, need many parameter combinations, want version-controlled formulas, or must reproduce historical values exactly. Include bar-access cost and request credits in the comparison.
技术指标范围
确认接口是否覆盖 RSI、MACD、均线、布林带、ATR、ADX、随机指标,以及应用需要的指标参数。
市场与周期覆盖
分别核实 A 股、美股、加密货币、外汇、ETF 或指数,以及日线、分钟线和实时数据是否需要额外权限。
响应结构与时效
检查时间戳、时区、数值类型、排序、复权规则和官方标明的数据延迟。
免费额度限制
核对每分钟和每日请求数、端点权重、历史深度、商用许可、署名要求,以及技术指标端点是否包含在免费层。
最新快照、历史序列还是解释性信号
只返回最新值的端点与完整历史序列解决的是不同问题。有些服务还会返回“超买”“交叉”或买卖标签,这属于供应商的解释结果。应要求说明规则、阈值、确认窗口和模型版本,不能把标签直接等同于原始指标。
公式与底层 K 线身份
记录平滑方法、初始值、输入价格、回看周期、标准差口径、精度与方法版本。每条结果还要关联底层行情供应商、交易场所、交易时段、时区、周期边界、K 线状态和公司行动复权方式,差异才有可能被解释。
预计算 API 还是本地指标库
只需要少量一致指标并希望降低接入工作时,可以使用 API;已经拥有合规 OHLCV 数据、需要大量参数组合、希望公式纳入版本控制或必须严格复现历史值时,更适合本地计算。比较时还要纳入底层 K 线成本和端点积分消耗。
Free technical analysis APIs worth testing值得实际测试的免费技术分析 API
There is no single provider that is automatically best for every indicator workflow. The practical shortlist depends on whether you want a broad catalog of pre-calculated indicators, a simple endpoint for one chart, or control over the source candles and formula. The candidates below publish technical-indicator documentation and offer a way to evaluate the service, but endpoint access, market-data entitlements, quotas, and commercial terms can change. Confirm the current plan page before building around any free allowance.
技术指标接口没有适用于所有场景的唯一答案。真正的选择取决于你需要大量预计算指标、只想快速完成一张图,还是希望自己控制底层 K 线与公式。下面几家均公开了技术指标文档,也提供了可用于评估的接入方式;但端点权限、行情授权、请求额度和商用条款都会变化,正式开发前仍要以最新套餐页为准。
| Provider供应商 | Good starting point适合从哪里开始 | What to verify必须核实 | Best fit更适合 |
|---|---|---|---|
| Alpha Vantage | Named functions for RSI, MACD, SMA, EMA, BBANDS, ATR, ADX and other indicators, with explicit interval and parameter inputs.以 RSI、MACD、SMA、EMA、BBANDS、ATR、ADX 等函数调用,周期和指标参数较直观。 | Whether the chosen function, interval, output size, asset, and underlying market data are available under the current key and plan.目标函数、周期、输出长度、资产类型和底层行情是否包含在当前密钥与套餐中。 | Learning, notebooks, scheduled analysis, and applications that prefer one documented function per indicator.学习、Notebook、定时分析,以及偏好“一个指标一个明确函数”的应用。 |
| Twelve Data | Indicator endpoints such as RSI, MACD and Bollinger Bands alongside time-series market data, with a consistent REST-style request model.在时间序列行情之外提供 RSI、MACD、布林带等指标端点,REST 请求方式较统一。 | Symbol and exchange resolution, interval availability, endpoint credit weight, history depth, and whether the returned candle is complete.代码与交易所解析、周期可用性、端点积分权重、历史深度,以及返回值是否基于已完成 K 线。 | Multi-asset prototypes that want market data and indicators through one API family.希望通过同一套 API 处理多资产行情与技术指标的原型项目。 |
| TAAPI.IO | A technical-analysis-focused API with individual and bulk indicator requests, useful when an application needs many indicator types without maintaining a calculation library.专注技术分析,提供单指标与批量指标请求,适合不想维护本地计算库、又需要多类指标的应用。 | Supported exchanges and assets, candle source, backtrack behavior, bulk-request accounting, data delay, and plan-specific limits.支持的交易所和资产、K 线来源、历史回溯方式、批量请求计费、数据延迟及套餐限制。 | Indicator-heavy alerts and dashboards where calculation convenience matters more than owning the formula implementation.指标密集的提醒和看板,且更看重计算便利性而非完全掌控公式实现。 |
| Local library + OHLCV API本地指标库 + OHLCV API | Fetch licensed bars once, then calculate indicators with TA-Lib, pandas-ta, or a version-controlled internal implementation.合规获取一次 K 线,再用 TA-Lib、pandas-ta 或纳入版本控制的内部实现计算。 | Market-data licensing, corporate-action treatment, session calendars, missing bars, library version, warm-up rules, and infrastructure cost.行情许可、公司行动处理、交易日历、缺失 K 线、库版本、预热规则和计算资源成本。 | Backtests, large parameter grids, auditable models, and workflows that require exact historical reproducibility.回测、大规模参数组合、可审计模型,以及必须精确复现历史结果的工作流。 |
Do not compare only the number of listed indicators. Ten well-documented indicators calculated from reliable, correctly adjusted bars can be more useful than two hundred opaque labels. Start with the exact symbol, market, interval, and parameter set your product needs, then compare the returned timestamps and values on the same completed candles.
不要只比较“支持多少个指标”。十个公式清楚、底层 K 线可靠且复权正确的指标,往往比两百个口径不透明的标签更有价值。应先固定产品真正需要的证券代码、市场、周期和参数,再在同一批已完成 K 线上比较时间戳与数值。
How to compare free technical indicator APIs如何比较免费股票技术指标 API
| Criterion比较维度 | What to check检查内容 | Why it matters重要原因 | Warning注意事项 |
|---|---|---|---|
| Coverage覆盖范围 | Indicators, assets, exchanges, intervals, and history.指标、资产、交易所、周期与历史深度。 | Matching the exact product workflow.匹配产品的实际工作流。 | Do not infer one market from another.不要由一个市场推断另一个市场。 |
| Free limits免费额度 | Rate limits, credits, endpoint access, and retention.频率、积分、端点权限与保存限制。 | Prototypes and low-frequency workflows.原型与低频工作流。 | Terms and quotas can change.条款和额度可能变化。 |
| Data quality数据质量 | Source bars, timestamps, adjustments, precision, and gaps.底层 K 线、时间戳、复权、精度与缺口。 | Backtests, alerts, dashboards, and agents.回测、提醒、看板和 Agent。 | Validate against documented examples.应按官方示例验证。 |
| Operations工程接入 | Authentication, errors, retries, caching, and status visibility.鉴权、错误、重试、缓存与服务状态。 | Reliable production integration.可靠的生产接入。 | A free tier is not an SLA.免费层不等于 SLA。 |
Recalculate a fixture before trusting the output. Download a fixed OHLCV sample and reproduce several returned values locally with the provider's stated formula. Match the price field, split and dividend adjustment, session boundary, timezone, bar-completion rule, lookback length, warm-up behavior, rounding, and—for volatility measures—the population or sample convention. Compare timestamps as well as numbers. Two correct implementations can disagree when one includes a still-forming candle or uses adjusted closes, so unexplained equality is not the only goal; a documented and repeatable calculation contract is.
信任结果前,先用固定样本复算。下载一段固定的 OHLCV 数据,依据供应商声明的公式在本地复算若干返回值。逐项核对价格字段、拆股与分红复权、交易时段边界、时区、K 线完成规则、回看长度、预热期、舍入方式,以及波动率指标采用总体还是样本口径。数字和时间戳都要比较。两个实现即使都正确,只要一个纳入尚未收盘的 K 线,或一个使用复权收盘价,结果就可能不同;验收目标不是强求所有数值无条件相等,而是得到有文档、可重复的计算契约。
For a chart or personal dashboard
Prioritize simple authentication, stable timestamps, the exact intervals displayed by the chart, and enough history to fill the longest lookback. A pre-calculated endpoint is often the fastest route because the product needs a small, predictable indicator set rather than thousands of parameter combinations.
For alerts and scanning
Quota arithmetic becomes central. Multiply the symbol universe by the number of indicators and polling cycles, then include retries and market-open bursts. Prefer batch requests, completed-candle caching, and explicit stale flags. A free plan that works for five symbols may fail immediately for five hundred.
For backtests and research
Own the historical bars and calculate locally when possible. Backtests need point-in-time data, stable formulas, reproducible library versions, and protection against survivorship, look-ahead, and adjustment errors. A convenient latest-indicator endpoint is not automatically a historical research dataset.
For an AI agent
Return evidence rather than a bare “buy” or “sell.” The tool result should include symbol identity, interval, indicator parameters, value, source-bar time, freshness, provider, and validation status. Require the agent to describe what the indicator measures and avoid presenting one technical signal as investment advice.
用于图表或个人看板
优先考虑鉴权是否简单、时间戳是否稳定、是否覆盖图表展示的准确周期,以及历史深度能否满足最长回看窗口。此类产品通常只需要少量固定指标,直接调用预计算端点往往比维护本地公式更省事。
用于提醒和批量扫描
请求额度会成为核心约束。应把标的数量乘以指标数量和轮询次数,再计入重试与开盘时段的突发请求。优先选择批量调用,对已完成 K 线做缓存,并明确标记过期结果。能支持 5 个标的的免费层,扩展到 500 个时可能立刻失效。
用于回测与研究
条件允许时,应保存自己的历史 K 线并在本地计算。回测需要时点一致的数据、稳定公式、可复现的库版本,还要防范幸存者偏差、未来数据泄漏和复权错误。一个方便的“最新指标”端点,并不天然等于合格的历史研究数据集。
用于 AI Agent
工具应返回证据,而不是只有“买入”或“卖出”。结果至少应包含证券身份、周期、指标参数、数值、底层 K 线时间、时效、供应商和验证状态;同时要求 Agent 解释指标衡量的含义,避免把单个技术信号包装成投资建议。
How to validate RSI, MACD, and other API values如何验证 RSI、MACD 等接口结果
A successful HTTP response proves only that the endpoint answered. It does not prove that the value matches your chart, backtest, or trading rule. Before accepting a provider, build a small fixture that preserves the exact source bars and makes every calculation choice visible.
HTTP 请求成功只说明端点有响应,并不能证明数值与你的图表、回测或交易规则一致。接入供应商前,应先建立一组保存完整底层 K 线的固定样本,并把每个计算选择明确记录下来。
1. Freeze one completed-candle dataset
Choose a liquid symbol and export at least 100 bars with symbol, exchange, interval, timezone, open, high, low, close, volume, adjustment status, and candle-close state. Keep the raw response as the acceptance fixture. A moving target cannot diagnose a one-point difference.
2. Reproduce RSI with the same initialization
For a 14-period RSI, confirm whether the first average gain and loss use a simple mean and whether subsequent values use Wilder smoothing. Check whether the provider starts returning a value after 14 changes or 14 rows. That single-row offset is a common source of disagreement.
3. Match MACD inputs, not just 12–26–9
Two MACD series can use the same nominal periods and still differ because of EMA seeding, price precision, missing bars, adjustment mode, or the inclusion of an open candle. Compare the MACD line, signal line, and histogram separately; do not validate only the final crossover label.
4. Test corporate actions and session boundaries
Repeat the check around a split or large dividend and across regular versus extended hours. For crypto, define the daily UTC boundary. A formula can be correct while the input series is wrong for the intended market session.
5. Set tolerances and failure behavior
Define an absolute or relative numeric tolerance before viewing the result. Fail closed when timestamps are stale, required bars are missing, parameters are omitted, or the returned series silently changes order. Store provider, formula parameters, bar timestamp, request time, and validation status with every signal.
1. 固定一组已收盘 K 线
选择流动性较好的标的,导出至少 100 根 K 线,保存证券代码、交易所、周期、时区、开高低收、成交量、复权状态和 K 线是否收盘。原始响应应作为验收样本长期保留;输入一直变化,就无法定位一个点位的差异。
2. 用相同初始值复算 RSI
以 14 周期 RSI 为例,需要确认首次平均涨幅与跌幅是否使用简单平均,后续是否采用 Wilder 平滑;还要确认供应商是在 14 次价格变化后,还是第 14 行就开始返回数值。只差一行,整条序列就可能对不上。
3. 验证 MACD 的输入,而不只是 12–26–9
即使周期都写成 12、26、9,EMA 初始值、价格精度、缺失 K 线、复权方式或是否纳入未收盘 K 线不同,MACD 仍会产生差异。应分别比较 DIF、信号线和柱状图,不能只检查最终的金叉或死叉标签。
4. 覆盖公司行动与交易时段边界
在拆股或大额分红附近再做一次测试,并分别验证常规时段与盘前盘后。加密货币还要明确日线采用哪个 UTC 边界。公式本身可能没有错,但输入序列未必符合目标市场口径。
5. 预先定义容差与失败处理
查看结果前先设定绝对或相对数值容差。时间戳过期、必要 K 线缺失、参数未回显或序列顺序静默变化时,应停止使用而不是继续生成信号。每条结果都应保存供应商、公式参数、K 线时间、请求时间和验证状态。
Example acceptance rule: accept a completed-bar RSI value only when the provider echoes the requested 14-period configuration, the source timestamp matches the fixture, at least 99% of non-null fixture values fall within the predefined tolerance, and no value appears inside the documented warm-up window. This turns “the chart looks close” into a repeatable test.
验收规则示例:只有当供应商回显 14 周期配置、底层时间戳与固定样本一致、至少 99% 的非空结果落在预设容差内,并且预热窗口中没有提前出现数值时,才接受这条基于已收盘 K 线的 RSI。这样,“看起来差不多”才能变成可重复执行的测试。
Free technical analysis API integration steps免费技术分析 API 接入步骤
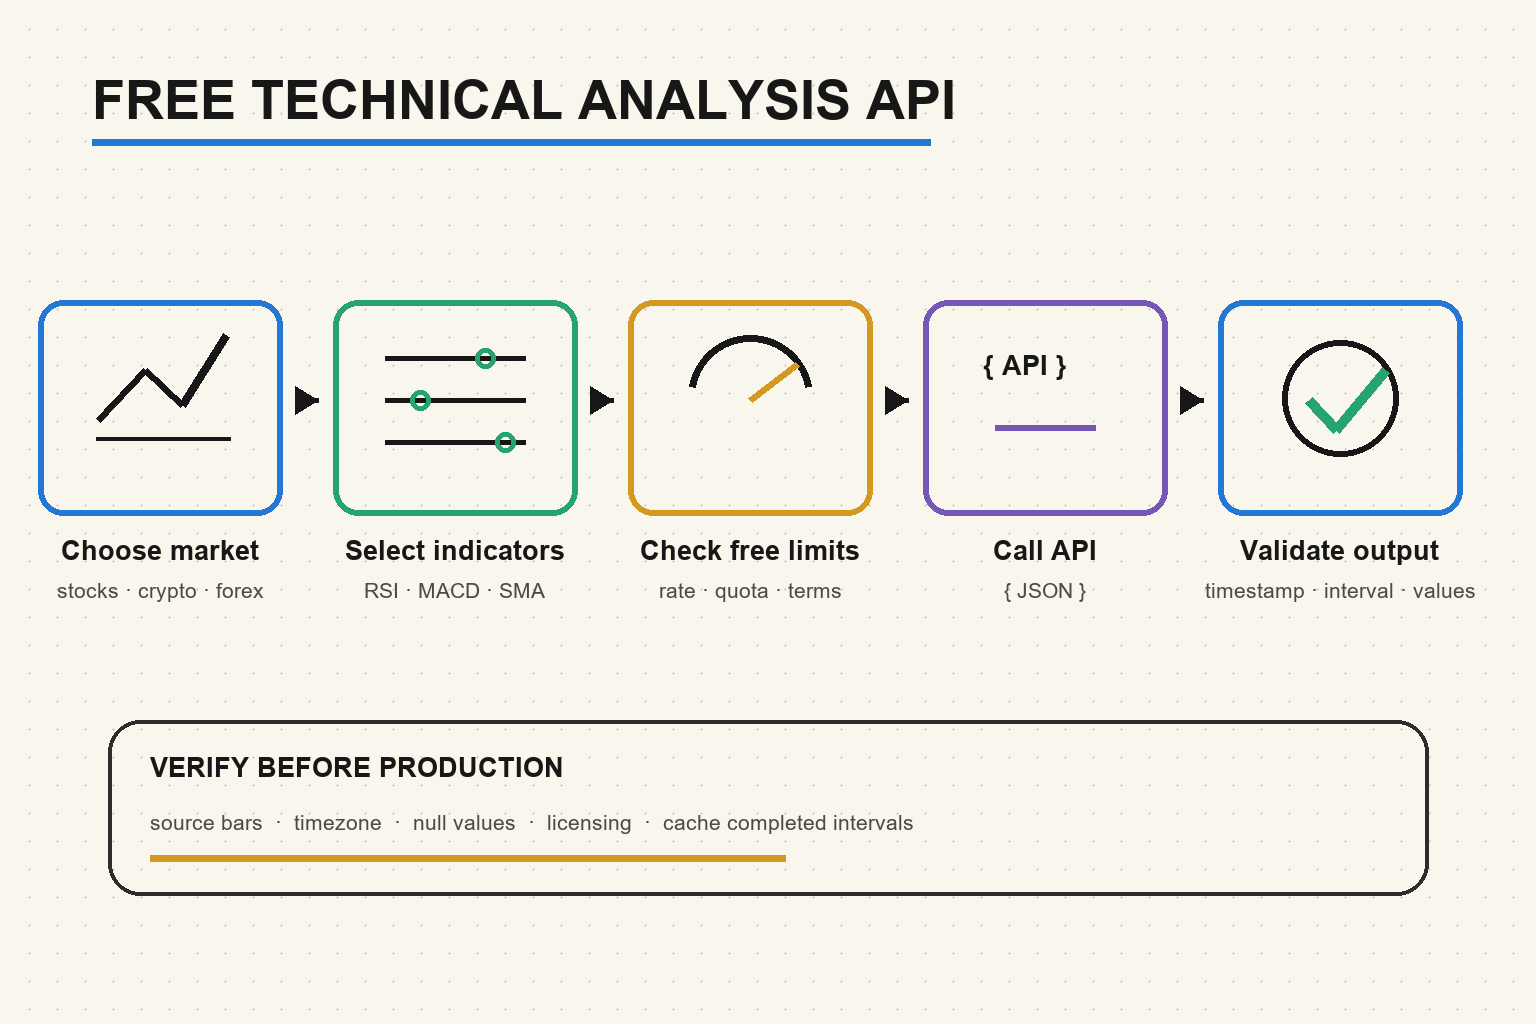
1. Define the market and indicator contract
Write down the symbol format, exchange, interval, timezone, adjustment mode, indicator, parameters, and minimum historical depth before comparing providers.
2. Test one documented API request
Use an official example, keep the key server-side, preserve the raw JSON, and record response headers plus the source-bar timestamp.
3. Normalize technical indicator JSON
Convert numeric strings safely, preserve null warm-up values, map timestamps with timezone awareness, and store provider and calculation parameters.
4. Add limits, caching, and validation
Back off after 429 responses, cache completed bars, reject stale or malformed values, and monitor provider notices before production use.
5. Build a cross-market acceptance set
Test a liquid stock, a corporate-action date, an interval with a gap, an extended-hours session, a 24/7 crypto pair, and a long-lookback indicator. Compare values and timestamps with an independent calculation, preserve warm-up nulls, and define numeric tolerances before reviewing results.
6. Monitor semantic drift
Track freshness, null rate, revision frequency, quota use, response schema, parameter defaults, and fixture disagreement. Stop or label a signal when validation fails. Carrying forward yesterday's value without a stale flag can make an alert or agent answer appear current when its evidence is not.
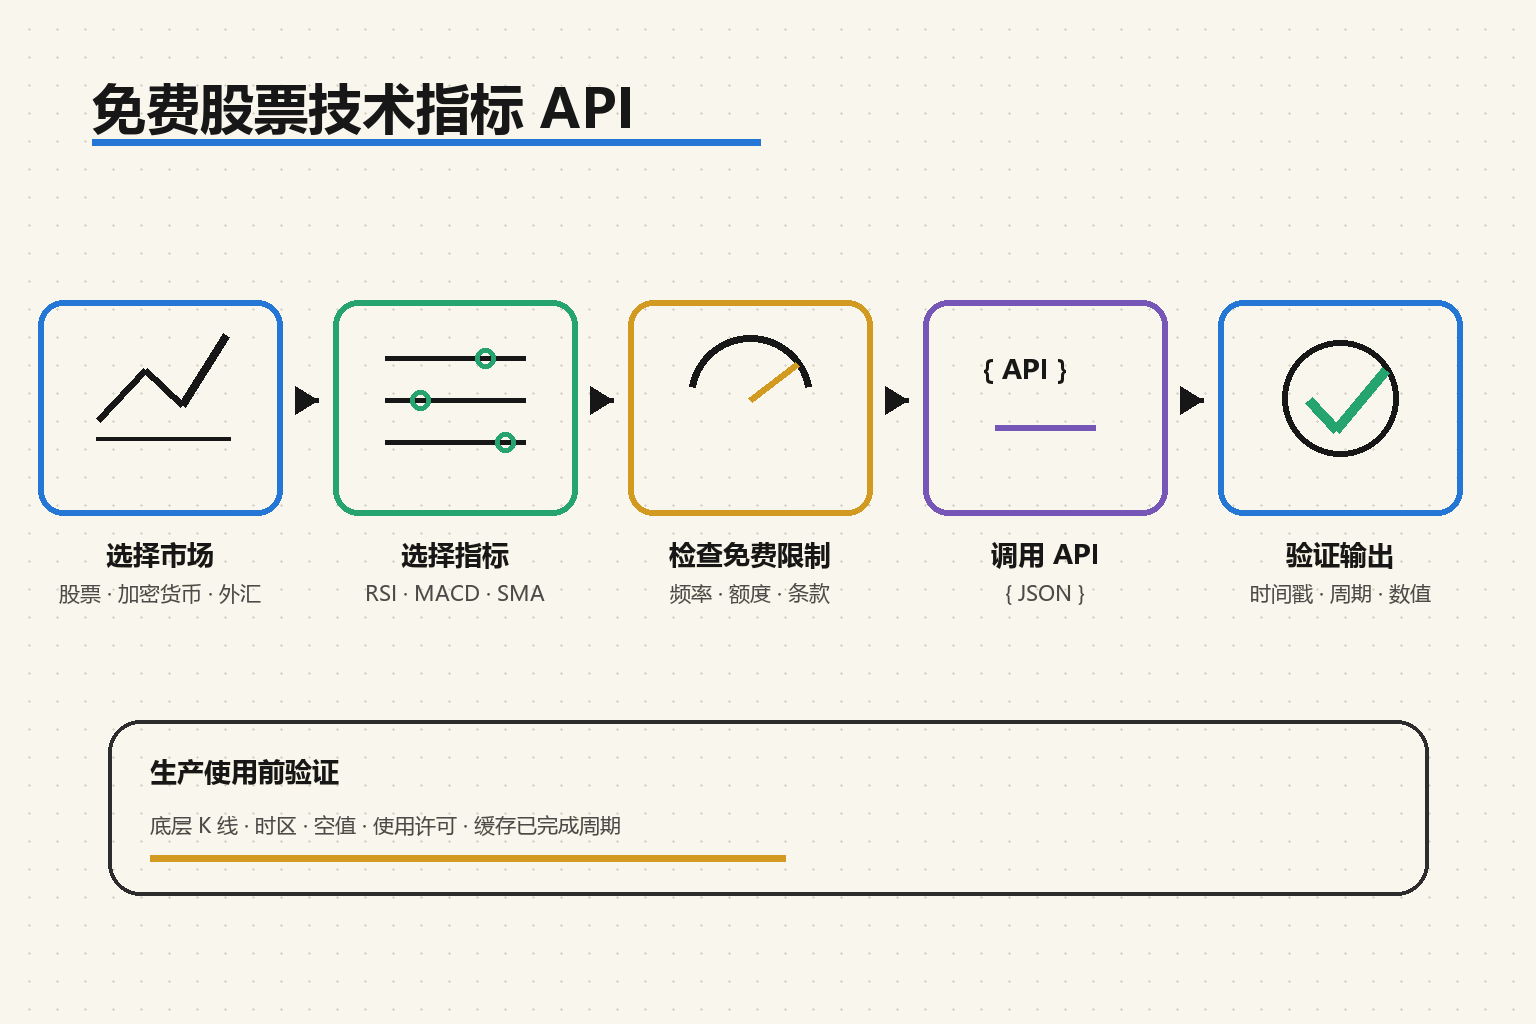
1. 定义市场与指标契约
比较供应商前先写清证券代码格式、交易所、周期、时区、复权方式、指标参数和最低历史深度。
2. 测试一条官方示例请求
使用官方文档示例,把密钥放在服务端,保留原始 JSON,并记录响应头与底层 K 线时间。
3. 规范化技术指标 JSON
安全转换数值字符串,保留预热期空值,按时区映射时间戳,并记录供应商和计算参数。
4. 添加限流、缓存与验证
遇到 429 时退避,按已完成 K 线缓存,拒绝过期或异常数值,并在生产使用前监控供应商公告。
5. 建立跨市场验收样本
测试一只流动性好的股票、一个公司行动日期、一段存在缺口的周期、一次盘前盘后时段、一个全天交易的加密货币对和一个长回看指标。用独立计算比较数值与时间戳,保留预热期空值,并在查看结果前先定义数值容差。
6. 监控数据语义漂移
跟踪新鲜度、空值率、修订频率、额度消耗、响应 Schema、默认参数和固定样本偏差。验证失败时应停止或标记相关信号。若没有过期标记就沿用昨日数值,提醒或 Agent 回答会显得仍然实时,实际证据已经失效。
Use QVeris to find technical analysis API capabilities用 QVeris 查找技术分析 API 能力
QVeris is a capability-routing network, not a market-data provider and not a guarantee that a third-party endpoint remains free. It can help an agent discover technical-analysis tools, inspect inputs and outputs, and call a selected capability under its documented terms.
QVeris 是能力路由网络,不是行情供应商,也不保证第三方接口持续免费。它能帮助 Agent 发现技术分析工具、检查输入输出,并依据目标工具的公开条款调用所选能力。
- Open the QVeris tool details for technical indicators, RSI, MACD, moving averages, or market-specific analysis capabilities.
- Inspect each tool’s symbol format, interval, parameters, output schema, provider identity, and published restrictions before calling it.
- Use the QVeris documentation to connect the selected capability to an agent workflow.
- 打开 QVeris 技术指标工具详情,核对 RSI、MACD、均线及市场参数。
- 调用前检查工具的代码格式、周期、参数、输出结构、供应商身份与公开限制。
- 参考 QVeris 文档,将选定能力接入 Agent 工作流。
Free technical analysis API FAQ免费技术指标 API 常见问题
Is there a free API for technical analysis?
Yes. Some providers offer limited free tiers for pre-calculated indicators. Confirm supported markets, endpoint access, delays, quotas, and commercial-use terms on current official pages.
Which technical indicators can an API return?
Common endpoints include RSI, MACD, SMA, EMA, Bollinger Bands, ATR, ADX, stochastic oscillators, and other price- or volume-derived series.
Can a free technical analysis API provide real-time data?
Sometimes. It depends on market-data entitlements and free-plan rules. Verify the source timestamp and documented delay rather than response speed.
How do I choose a technical indicator API?
Match asset class, indicators, intervals, history, schema, quotas, licensing, status visibility, and reliability to the exact application requirement.
有免费的股票技术指标 API 吗?
有。部分供应商提供预计算指标的有限免费层,但必须在最新官方页面核实市场、端点、延迟、额度与商用条款。
技术指标 API 能返回哪些指标?
常见端点包括 RSI、MACD、SMA、EMA、布林带、ATR、ADX、随机指标及其他价格或成交量衍生序列。
免费接口能返回实时技术指标吗?
有可能,取决于市场数据权限和免费层规则。应检查底层时间戳与官方延迟说明,而不是仅看响应速度。
如何选择技术指标数据接口?
应把资产类型、指标、周期、历史深度、响应结构、额度、许可、服务状态和可靠性与实际应用需求逐项匹配。