
Choose a Free Yield Curve API
for Treasury Data选择并调用
免费收益率曲线 API
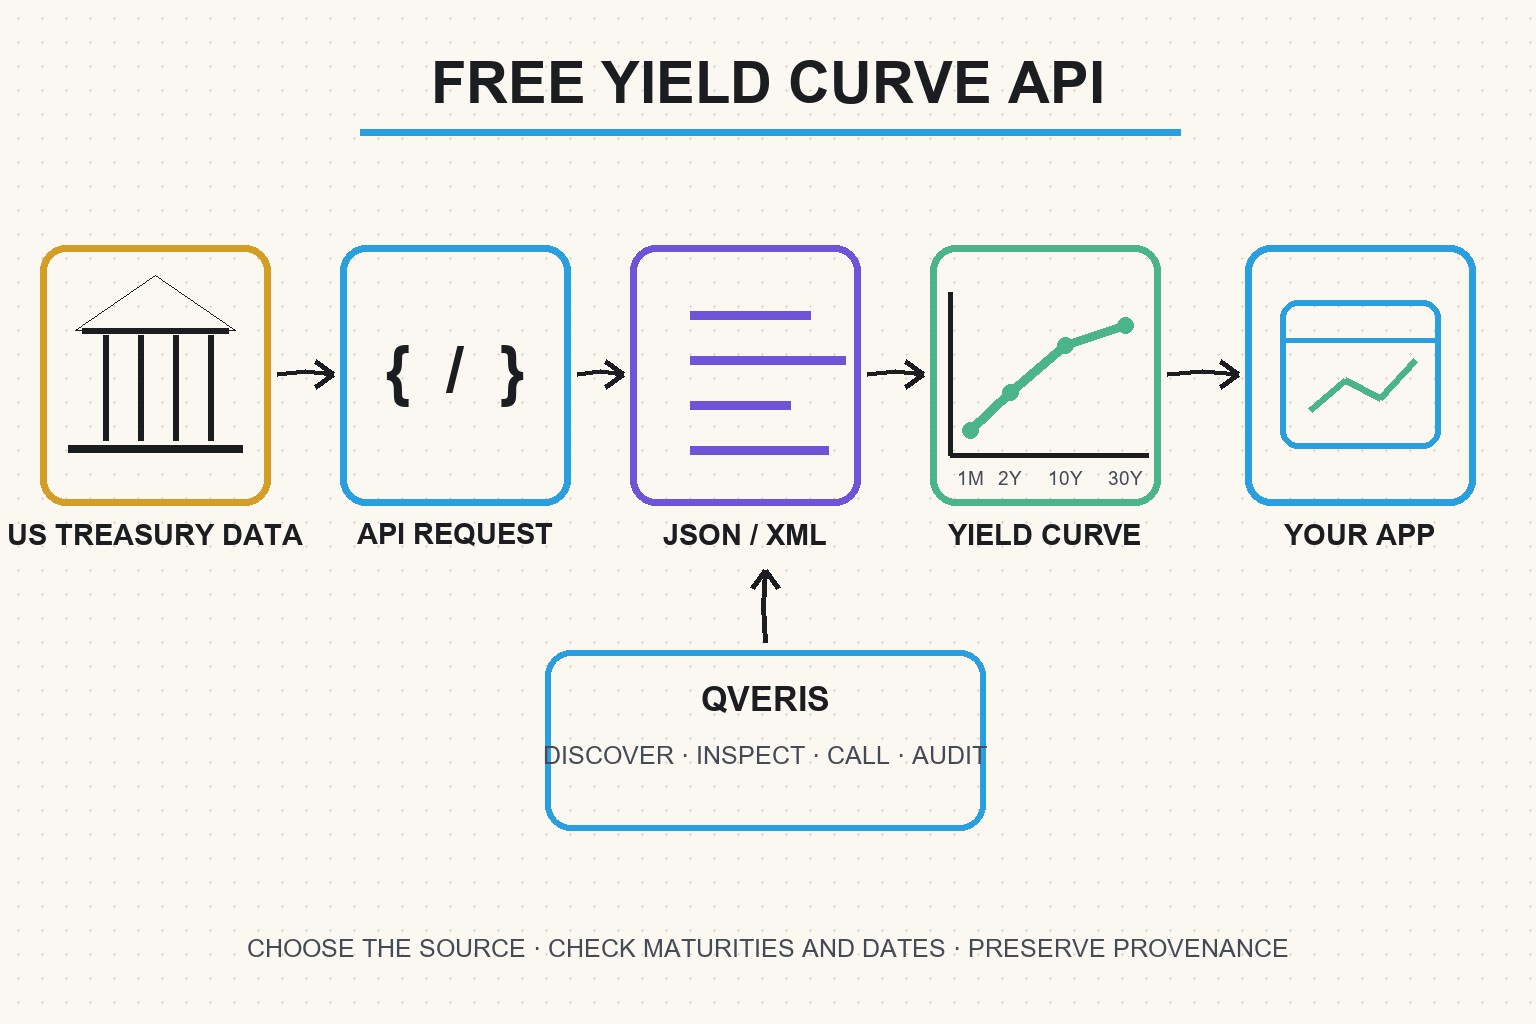
Compare free US Treasury yield curve data sources, then make a verified JSON or Python request across maturities.
比较免费的美国国债收益率曲线数据源,
再用 JSON 或 Python 按期限完成可验证调用。
TL;DR快速结论
A practical shortlist of free official or aggregated APIs, plus enough detail to make a first verified request.
Daily Treasury par yields, real yields, bill rates, maturities, history, and common curve spreads.
Check registration, API keys, quotas, licensing, attribution, formats, and production restrictions.
Choose one source, inspect metadata, make a small request, validate provenance, then add caching.
一份可用的免费官方或聚合 API 清单,以及完成第一次可验证调用所需的信息。
美国国债每日票面收益率、实际收益率、国库券利率、期限、历史数据和常见期限利差。
注册、API Key、额度、许可、署名、返回格式和生产使用限制。
选择一个来源,检查元数据,小范围调用,验证出处,再加入缓存。
What people want from a free yield curve API用户搜索免费收益率曲线 API 时要完成什么
Current results are dominated by API documentation, free tool pages, official Treasury feeds, and implementation guides. The primary intent is practical informational: find a free endpoint and retrieve current or historical yield curve observations programmatically. A secondary commercial-investigation intent appears when users compare key requirements, quotas, history, country coverage, and normalized JSON.
当前中文结果更偏向官方国债收益率曲线查询、数据门户与开发文档。用户的核心需求是找到可信数据源,并通过程序获取美国国债各期限的当前或历史收益率;其次是比较 API Key、调用额度、历史范围、国家覆盖和 JSON 格式。
Data and features repeated across ranking pages排名页面反复覆盖的数据与功能
Recurring entities include the U.S. Treasury, FRED, Treasury par yield curve rates, real yield curves, 1-month through 30-year maturities, curve slope, historical observations, REST or XML access, JSON output, API keys, quotas, dates, units, and provenance.
反复出现的实体包括美国财政部、FRED、国债票面收益率曲线、实际收益率曲线、1 个月至 30 年期限、曲线斜率、历史观测、REST 或 XML、JSON、API Key、额度、日期、单位和出处。
Par, spot, forward, and real yield curves are different datasets票面、即期、远期与实际收益率曲线不是同一种数据
Before choosing a yield curve API, define what every point means. A curve is a set of rates indexed by maturity, but providers may publish different curve concepts, use different instruments as inputs, and apply different interpolation methods. The U.S. Treasury’s official nominal curve is a par curve: its constant-maturity values are read at fixed tenors from an estimated curve and may not equal the yield of any single outstanding security. It is not a live trade feed and it is not automatically a zero-coupon discount curve.
选择收益率曲线 API 前,必须先定义每个点的含义。曲线虽然都是按期限排列的利率集合,但不同提供方可能发布不同曲线概念,使用不同输入证券并采用不同插值方法。美国财政部官方名义曲线属于票面收益率曲线:固定期限数值从估计曲线读取,未必等于任何一只存量国债的真实收益率。它不是实时成交行情,也不能直接当成零息贴现曲线。
| Curve曲线 | Meaning含义 | Typical use典型用途 | Do not assume不能默认 |
|---|---|---|---|
| Par curve票面曲线 | Coupon rates that would price hypothetical bonds at par under the curve methodology.按曲线方法使假设债券价格等于面值的票息率。 | Market-rate overview, tenor comparison, benchmark communication.利率环境概览、期限比较与基准展示。 | That each point is an actual traded bond.每个点都对应一只真实成交债券。 |
| Spot or zero curve即期或零息曲线 | Rates for discounting one cash flow at each maturity.用于贴现各期限单笔现金流的利率。 | Present value, discount factors, cash-flow valuation.现值、贴现因子与现金流估值。 | That a published par curve can be used without bootstrapping.票面曲线无需转换即可直接贴现。 |
| Forward curve远期曲线 | Rates implied between future dates by a spot curve and convention.根据即期曲线与约定推导的未来区间隐含利率。 | Scenario analysis and implied-rate comparisons.情景分析与隐含利率比较。 | That forward rates are unbiased forecasts.远期利率就是无偏预测。 |
| Real curve实际收益率曲线 | Inflation-indexed government-bond curve, such as Treasury TIPS inputs.以通胀挂钩政府债为基础的曲线,例如美国 TIPS。 | Real discounting and inflation-compensation analysis.实际贴现与通胀补偿分析。 | That nominal minus real is pure expected inflation.名义减实际完全等于预期通胀。 |
Know the official U.S. Treasury methodology理解美国财政部官方曲线方法
Treasury states that its current par curve uses indicative bid-side quotations—not actual transactions—for recently auctioned securities near 3:30 PM Eastern on trading days. Prices are converted to yields, instantaneous forward rates are bootstrapped at input maturities, and a monotone-convex interpolation constructs the curve. The method replaced the former quasi-cubic Hermite approach on December 6, 2021. A historical pipeline should preserve this methodology break instead of treating the entire series as if it were generated identically.
美国财政部说明,当前票面曲线使用交易日美东时间约 15:30 获取的近期发行证券参考买方报价,而非实际成交。输入价格先转为收益率,再通过自举法计算各输入期限的瞬时远期利率,并用单调凸插值构建完整曲线。该方法于 2021 年 12 月 6 日取代原有的准三次 Hermite 方法。历史数据管道应保留这一方法变化的时间点,不能假设全部历史观测都采用完全相同的口径。
Free yield curve API sources to evaluate值得评估的免费收益率曲线数据接口
| Source来源 | Typical coverage典型覆盖 | Interface接口形式 | Check before use使用前核对 |
|---|---|---|---|
| U.S. Treasury XML feed美国财政部 XML 数据源 | Official daily par yield curve rates and other Treasury rate datasets.官方每日国债票面收益率曲线及其他财政部利率数据。 | Keyless GET requests returning XML.免 Key GET 请求,返回 XML。 | Dataset parameter, year filter, XML parsing, dates, and attribution.数据集参数、年份筛选、XML 解析、日期和署名。 |
| FRED API | Individual Treasury constant-maturity series with long histories.单个美国国债固定期限序列及长历史数据。 | REST XML or JSON; free API key required.REST XML 或 JSON;需要免费 API Key。 | Series IDs, frequency, units, revisions, and joining maturities by date.序列 ID、频率、单位、修订及按日期合并多个期限。 |
| ECB Data Portal欧洲央行数据门户 | Euro-area government-bond par, spot, and forward curve series.欧元区政府债票面、即期与远期曲线序列。 | ECB Data API and downloadable SDMX/CSV formats.ECB Data API 及 SDMX/CSV 下载。 | Rating universe, curve type, maturity parameter, methodology, and calendar.评级样本、曲线类型、期限参数、方法与发布日历。 |
| Other aggregators其他聚合服务 | Normalized sovereign curves, sometimes across several countries.标准化主权债收益率曲线,部分覆盖多个国家。 | Usually REST JSON with provider-specific free terms.通常为 REST JSON,免费条款因提供方而异。 | Original source, transformations, latency, licensing, and current status.原始来源、转换方法、延迟、许可和当前可用状态。 |
“Free” does not mean identical terms. Verify each provider’s documentation on the day you integrate it because authentication, quotas, acceptable use, and dataset availability can change.
“免费”不代表条款完全相同。接入当天仍应核对各提供方文档,因为认证、额度、合理使用规则和数据集可用性可能变化。
How to use a free yield curve API with Python如何用 Python 调用免费收益率曲线 API
1. Define the curve type, country, and maturities1. 明确曲线类型、国家和期限
Specify whether you need a nominal par curve, real curve, bill rates, spot curve, or forward curve; then define country, maturities, observation date, frequency, units, and required history. These curve types are not interchangeable.
先明确需要名义票面曲线、实际收益率曲线、国库券利率、即期曲线还是远期曲线,再定义国家、期限、观测日期、频率、单位和历史区间。这些曲线类型不能混用。
2. Inspect metadata, authentication, and limits2. 检查元数据、认证和调用限制
Confirm curve type, tenor labels, unit, compounding basis, observation time, timezone, methodology, API-key requirement, rate limits, reuse license, and attribution before writing production code. Treat “10Y” as a tenor label until documentation confirms whether it is a constant-maturity point, a specific bond, or a modeled zero rate.
编写生产代码前,要确认曲线类型、期限标签、单位、复利基础、观测时间、时区、方法、API Key、限流、再使用许可和署名。看到“10Y”时只能先把它当作期限标签,必须通过文档确认它究竟是固定期限曲线点、某只具体债券,还是模型化零息利率。
3. Make a small request and validate it3. 小范围调用并验证响应
This Python example retrieves the official Treasury XML feed, extracts 2-year and 10-year constant-maturity par yields, and calculates the 2s10s slope in basis points. It keeps the observation date and source so the output remains auditable. It is an end-of-day curve example, not a real-time executable quote.
下面的 Python 示例读取美国财政部官方 XML,提取 2 年期与 10 年期固定期限票面收益率,并计算以基点表示的 2s10s 斜率。结果保留观测日期和来源,便于审计。这是日终曲线示例,不是实时可成交报价。
import requests
import xml.etree.ElementTree as ET

url = (
    "https://home.treasury.gov/resource-center/data-chart-center/"
    "interest-rates/pages/xml"
)
params = {
    "data": "daily_treasury_yield_curve",
    "field_tdr_date_value": "2025",
}
response = requests.get(url, params=params, timeout=30)
response.raise_for_status()
root = ET.fromstring(response.content)

ns = {
    "atom": "http://www.w3.org/2005/Atom",
    "m": "http://schemas.microsoft.com/ado/2007/08/dataservices/metadata",
    "d": "http://schemas.microsoft.com/ado/2007/08/dataservices",
}

rows = []
for entry in root.findall("atom:entry", ns):
    props = entry.find("atom:content/m:properties", ns)
    if props is None:
        continue
    date = props.findtext("d:NEW_DATE", default="", namespaces=ns)
    y2 = props.findtext("d:BC_2YEAR", default="", namespaces=ns)
    y10 = props.findtext("d:BC_10YEAR", default="", namespaces=ns)
    if date and y2 and y10:
        rows.append({
            "date": date,
            "2y_percent": float(y2),
            "10y_percent": float(y10),
            "2s10s_bp": round((float(y10) - float(y2)) * 100, 1),
            "source": "U.S. Department of the Treasury",
        })

assert rows, "No complete 2Y/10Y observations returned"
print(rows[-1])
4. Add caching, retries, and provenance4. 加入缓存、重试和出处记录
Cache to match the release schedule, respect retry guidance, record retrieval time and series metadata, preserve the source URL, and monitor schema changes.
按发布日程缓存,遵循重试建议,记录抓取时间和序列元数据,保留来源 URL,并监控数据结构变化。
Validate a yield curve API response before publishing it发布前验证收益率曲线 API 响应
A successful HTTP response does not prove that a valid curve was returned. Validate provider, country, currency, curve family, nominal or real status, par/spot/forward type, tenor, unit, compounding convention, observation date, publication time and methodology version. Verify that all points in one curve share the same observation date. Missing tenors must remain missing; interpolating them is a model decision that needs a separate flag and method.
HTTP 请求成功并不代表得到了一条有效曲线。应验证提供方、国家、币种、曲线家族、名义或实际属性、票面/即期/远期类型、期限、单位、复利约定、观测日期、发布时间与方法版本。同一条曲线的全部点必须共享同一观测日期。缺失期限应保持缺失;插值属于模型决策,必须单独标记方法。
Use a wide-curve integrity check执行整条曲线完整性检查
Build a composite key from provider, curve type, country, currency, observation date and tenor. Reject duplicate tenor rows, percentages parsed as decimals without conversion, impossible tenor ordering, dates in the future, and curves assembled from mixed publication days. Compare several official values to the visible Treasury table. Preserve raw XML or JSON, request parameters, HTTP headers and retrieval time so a later reviewer can reproduce the snapshot.
可使用提供方、曲线类型、国家、币种、观测日期和期限构建复合主键。重复期限、百分数与小数比例误读、期限顺序异常、未来日期以及混合不同发布日期拼成的曲线都应拒绝。还要把多个官方数值与财政部可见表格核对,并保存原始 XML/JSON、请求参数、HTTP 响应头与抓取时间。
Calculate 2s10s and other yield-curve spreads correctly正确计算 2s10s 及其他期限利差
A curve spread is normally the longer-maturity yield minus the shorter-maturity yield for the same curve and observation date. For rates expressed in percent, multiply the percentage-point difference by 100 to report basis points. If the 10-year rate is 4.20% and the 2-year rate is 4.55%, then 2s10s equals −35 basis points. A negative slope is commonly described as an inversion. Do not reverse the subtraction silently, mix a real yield with a nominal yield, or combine closing observations from different dates.
期限利差通常等于同一曲线、同一观测日的长期收益率减去短期收益率。若原始单位为百分比,百分点之差乘以 100 即可得到基点。假设 10 年期为 4.20%、2 年期为 4.55%,则 2s10s 为 −35 个基点,负斜率通常称为倒挂。不能在没有说明的情况下颠倒减法方向,也不能混用实际收益率和名义收益率,或组合不同日期的收盘观测。
An inversion is a signal, not a standalone forecast曲线倒挂是信号,不是独立预测结论
2s10s, 3m10y and 10s30s measure different curve segments and can tell different stories. Their relationship with future growth depends on the sample, policy regime, market expectations and chosen horizon. A dashboard should state the exact legs, subtraction direction, units and observation date. An agent should describe what changed and cite the data, but avoid presenting one inverted spread as proof that a recession will occur on a specific date.
2s10s、3m10y 和 10s30s 衡量不同的曲线区间,可能给出不同信息。它们与未来增长的关系取决于样本、政策环境、市场预期和观察期限。看板必须注明两端期限、减法方向、单位与观测日期;Agent 可以描述变化并引用数据,但不应把某一次倒挂写成经济将在特定日期衰退的证明。
Build point-in-time yield-curve history without look-ahead bias构建无前视偏差的历史收益率曲线
Align calendars and preserve the data available at the time对齐交易日历并保存当时可获得的数据
Yield curves are usually published on business days, so weekends and holidays are not zeros. A backtest must define whether a missing date remains missing or carries the most recent published curve forward; either choice should be explicit. Store observation time separately from retrieval time. If a provider later corrects history or changes methodology, a research pipeline may need both the latest corrected series and the snapshot originally available to the strategy. FRED’s observation API supports real-time periods and vintage parameters for applicable series, but those controls still require careful documentation and do not automatically make every derived spread point-in-time safe.
收益率曲线通常只在工作日发布,因此周末和节假日不是零值。回测必须明确缺失日期是保持缺失,还是沿用最近一次已发布曲线;两种选择都要记录。观测时间与抓取时间应分开保存。如果提供方后来更正历史或改变方法,研究管道可能同时需要最新修订序列和策略当时真正可见的快照。FRED 观测接口对适用序列支持实时区间和历史版本参数,但仍需仔细记录;这些参数并不能自动保证所有衍生利差都满足历史时点安全要求。
Do not manufacture unavailable maturities不要伪造历史上不存在的期限
The set of published Treasury maturities has changed over time. Some tenors begin later, and the 30-year constant-maturity series has a historical discontinuation and resumption. A stable modern column set can therefore create large historical gaps. Keep availability metadata, avoid backfilling a tenor before its official start, and flag any interpolation or proxy. When methodology changes, segment analysis or include a method indicator so apparent structural shifts are not mistaken for market signals.
美国财政部公布的期限集合会随时间变化,部分期限开始较晚,30年固定期限序列也经历过停发与恢复。使用现代固定列集会在历史区间产生大量缺口。应保留可用性元数据,不得把期限回填到官方开始时间之前;任何插值或代理值都要标记。方法发生变化时,应分段分析或加入方法指示变量,避免把结构性口径变化误判为市场信号。
Official Treasury feeds vs aggregated yield curve APIs官方财政部数据源与收益率曲线聚合 API 怎么选
The U.S. Treasury feed is the strongest starting point when authority and direct provenance matter most. It publishes the curve observations and supporting definitions, but its XML format requires parsing and may be less convenient than a normalized JSON endpoint. Aggregators can simplify curve snapshots, spreads, cross-country coverage, and agent integrations, but their transformations and free-tier terms must be inspected.
最重视权威性与直接出处时,美国财政部数据源是首选。它提供曲线观测与定义,但 XML 解析不如标准化 JSON 方便。聚合 API 可简化曲线快照、期限利差、跨国覆盖和 Agent 接入,但必须检查其转换逻辑和免费套餐条款。
When an aggregator is the better engineering choice什么时候更适合使用聚合 API
An aggregator is useful when the application needs one query model across several providers or countries. A normalized catalog can reduce discovery time, standardize common fields, and simplify prototypes, dashboards, comparative research, or agent tools. That convenience does not transfer authority to the aggregator. Always retain the original provider code, dataset code, series identifier, unit, frequency, retrieval timestamp, and source URL. Review whether the aggregator transforms values, renames dimensions, changes missing-value markers, delays updates, or applies a separate license. For high-impact outputs, compare representative observations with the original portal and define a fallback path to the producer’s service.
需要统一查询多个国家或提供方时,聚合 API 更适合原型、跨国看板和 Agent 工具,但不会取代原始机构的权威性。应保存提供方、数据集与序列 ID、单位、频率、抓取时间和来源 URL,并检查数值转换、更新延迟和许可;重要结果仍需与官方门户核对。
Validate metadata, revisions, and data quality before use使用前验证元数据、修订与数据质量
Do not treat a series label as a complete definition不要把序列名称当作完整定义
Two “10-year Treasury” fields can represent different concepts: a constant-maturity par-curve point, a specific on-the-run bond quote, a monthly average, a real TIPS yield, or a derived spread leg. Capture title, curve family, input universe, methodology, unit, compounding convention, frequency, timezone, valuation time and publication schedule. Keep dimension codes together with their labels instead of relying on compact names such as 10Y.
两个“10年期美国国债”字段可能分别表示固定期限票面曲线点、某只最新发行债券报价、月度均值、TIPS 实际收益率或衍生利差的一端。必须保存名称、曲线家族、输入样本、方法、单位、复利约定、频率、时区、估值时间与发布日程,并把维度代码与可读标签一起保留,不能只依赖 10Y 这样的简写。
Design explicitly for revisions and missing observations显式处理修订值与缺失观测
Providers may correct observations, add a newly issued tenor, modify curve inputs, or change interpolation methodology. Decide whether the product shows the latest official history or preserves the curve retrieved on each date. Never convert a blank value to zero. Keep status flags and detect duplicated dates, unexpected tenor changes, unit shifts, mixed curve types, implausible jumps and a latest observation that is older than the documented publishing window.
提供方可能更正观测、增加新发行期限、调整曲线输入或改变插值方法。产品必须明确展示最新官方历史,还是保留每天抓取到的曲线快照。空值绝不能转成零;同时要检测重复日期、期限集合异常、单位变化、曲线类型混用、无法解释的跳变,以及超过官方发布时间窗口仍未更新的最新观测。
Build a reliable production integration构建可靠的生产级数据接入
Separate discovery, retrieval, normalization, and delivery分离发现、抓取、标准化与交付
A maintainable pipeline gives each stage one responsibility. Discovery resolves a human request to a provider, dataset, and series. Retrieval calls the documented endpoint and stores the raw response with HTTP status, headers, request parameters, and retrieval time. Normalization converts dates, units, codes, and missing-value conventions into an internal schema without destroying the source representation. Delivery exposes the verified records to a dashboard, research notebook, database, API, or agent capability. Keeping the raw payload makes later debugging and reprocessing possible when a provider changes its schema or a transformation rule is corrected.
数据管道应分离发现、抓取、标准化和交付。抓取阶段保存原始响应、HTTP 状态、请求参数和时间;标准化阶段统一日期、单位和缺失值,但保留原始表达;交付阶段再向看板、数据库、API 或 Agent 提供已验证数据。保留原始响应便于重新处理。
Match polling, caching, and retries to the release schedule让轮询、缓存和重试匹配发布日程
Treasury says its rates are usually available by 6:00 PM Eastern on trading days, although publication can be delayed. Poll around the documented window instead of continuously. Cache successful curves by provider, type and observation date; update the latest partition without rebuilding every year. Use bounded retry with backoff for temporary failures, never retry invalid parameters forever, and protect API keys outside client-side code. Alert on stale curves, missing tenors, schema changes and a sudden shift from percent to decimal units. A fallback source must represent the same curve concept—not merely return rates with similar maturity labels.
美国财政部说明,交易日曲线通常在美东时间 18:00 前发布,但也可能延迟。应围绕官方时间窗口轮询,而不是持续请求。按提供方、曲线类型和观测日期缓存,只更新最新分区,避免重复重建全部历史。临时故障可有限退避重试,无效参数不能无限请求,API Key 不能写入客户端。还要监控曲线陈旧、期限缺失、数据结构变化,以及单位从百分比突然变成小数。备用来源必须代表同一曲线概念,不能只因为期限标签相似就替换。
Common applications for yield curve data收益率曲线 API 的常见应用场景
Research, dashboards, alerts, and AI agents研究、看板、提醒与 AI Agent
Developers use the curve for fixed-income dashboards, maturity comparisons, 2s10s or 10s30s spread monitoring, recession-research inputs, discount-rate context, backtests, and data-aware agents. Historical research needs reproducible snapshots, while operational dashboards need the latest observation plus separate observation and retrieval timestamps.
开发者可把曲线用于固定收益看板、期限比较、2 年/10 年或 10 年/30 年利差监控、衰退研究输入、贴现率背景、回测和数据型 Agent。历史研究需要可复现快照,运营看板则要分别展示观测日期与抓取时间。
For an AI agent, expose narrow operations such as “get the latest nominal par curve,” “retrieve a curve for one observation date,” or “calculate a named spread from matching tenors.” Define country, curve type, units, supported maturities, error states and provenance. The agent should cite the producer, state the observation date, distinguish sourced values from calculated spreads, and avoid treating forward rates or inversions as certain forecasts. QVeris can help discover, inspect, call and audit these capabilities while the original producer remains authoritative for values and methodology.
面向 AI Agent 时,应把“获取最新名义票面曲线”“读取某一观测日曲线”或“使用匹配期限计算指定利差”等任务封装成范围明确的操作,并说明国家、曲线类型、单位、支持期限、错误状态与出处。Agent 必须引用发布机构和观测日期,区分来源数值与自行计算的利差,并避免把远期利率或曲线倒挂写成确定预测。QVeris 可帮助查找、检查和调用这些能力,并保留审计记录;原始机构仍是数值与方法的权威来源。
How QVeris helps with yield curve APIsQVeris 如何帮助接入收益率曲线 API
QVeris can help an agent discover, inspect, call, and audit real-world capabilities. For yield-curve data, each API should remain an inspectable capability with documented inputs, outputs, and provenance. QVeris does not own or change the underlying official data.
QVeris 可帮助 Agent 查找、检查和调用真实世界的工具,并保留审计记录。对于收益率曲线数据,API 的输入、输出和出处应当可核查;QVeris 不拥有,也不会改变底层官方数据。
- Use the QVeris Tool Finder to explore capabilities relevant to economic or financial data.
- Inspect an operation’s parameters and response shape before an agent calls it.
- Keep the provider URL, timestamp, series ID, and license context in downstream records.
- 使用 QVeris 工具查找器探索经济或金融数据相关能力。
- 在 Agent 调用前检查操作参数和响应结构。
- 在下游记录中保留提供方 URL、时间戳、序列 ID 和许可信息。
FAQ
Yes. The U.S. Treasury provides a keyless official XML feed, FRED exposes individual Treasury maturity series with a free key, and some aggregators offer limited free JSON access.
Start with the U.S. Treasury daily interest-rate feed for direct provenance. FRED is useful when you want individual constant-maturity series and a JSON API.
FRED provides individual Treasury constant-maturity series through its API. To build a curve, request the required maturities and align observations by date.
Use requests or a maintained client, send a small date-bounded query, check HTTP status and JSON fields, then store the series ID, units, date, and source.
No. The main nominal constant-maturity table is a par yield curve. A zero-coupon spot curve must be obtained from a documented spot dataset or derived with a stated bootstrapping method.
Subtract the 2-year yield from the 10-year yield for the same curve and observation date. Multiply a percentage-point difference by 100 to report basis points.
No. Inversion is a market signal whose interpretation depends on the spread, sample, policy regime, and forecast horizon. It is not proof of a recession on a specific date.
No. QVeris helps agents discover and call capabilities; the provider remains authoritative for data, methods, licensing, and releases.
美国财政部提供无需 Key 的官方 XML 数据源,FRED 可用免费 Key 获取各期限序列,部分聚合服务还提供有额度限制的 JSON 免费套餐。
重视直接出处时使用美国财政部每日利率数据源;需要 JSON 和单个固定期限长历史时可评估 FRED API。
可以。分别请求所需的美国国债固定期限序列,再按同一观测日期对齐,即可构建曲线。
用 requests 发起限定年份或日期的请求,检查 HTTP 状态和字段,并保存期限、单位、观测日期与来源。
不是。主要名义固定期限表是票面收益率曲线。零息即期曲线需要来自有文档的即期数据集,或使用明确的自举法推导。
使用同一曲线和同一观测日的 10 年期收益率减去 2 年期收益率。百分点之差乘以 100 后得到基点。
不一定。倒挂是市场信号,其解释取决于具体利差、样本、政策环境和预测期限,不能证明经济会在某个特定日期衰退。
不会。QVeris 帮助 Agent 调用能力,原始提供方仍是数据、方法、许可和发布时间的权威来源。