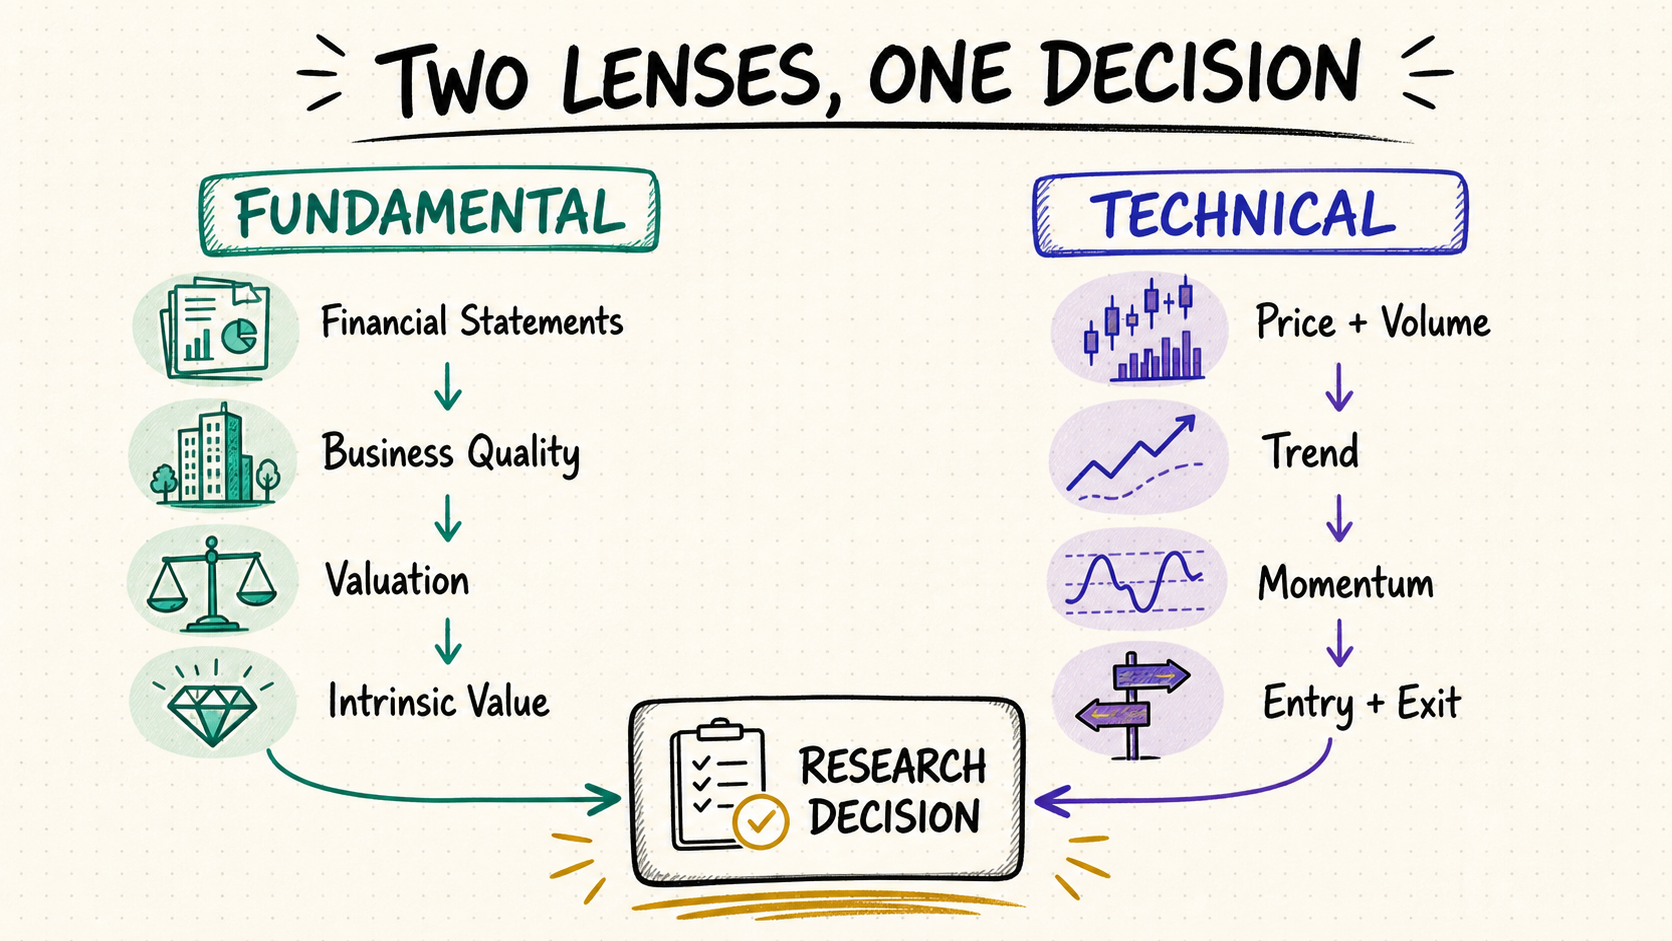
Fundamental Analysis vs Technical Analysis Two Lenses, Different Decisions基本面分析与技术分析 两种视角,不同决策
Fundamental analysis vs technical analysis compares business value with market behavior: one studies what may be worth owning, while the other studies how price and volume are behaving.
What fundamental and technical analysis actually do基本面分析和技术分析分别做什么
The methods are often presented as rivals, but they answer different questions and use different evidence. Neither method observes the future directly. Each builds a decision framework from imperfect data, assumptions, and a defined time horizon.
Fundamental analysis studies a company, industry, and economic setting to form a view of earning power, financial resilience, growth, and intrinsic value. It usually begins with filings and financial statements, then tests what assumptions must be true for the current price to be attractive.
Inputs输入Income statement, balance sheet, cash flow, filings, industry and macro data利润表、资产负债表、现金流量表、公告、行业和宏观数据
Outputs输出Earnings view, quality assessment, valuation range, thesis and risks盈利判断、质量评估、估值区间、投资逻辑与风险
TECHNICAL LENS
Measure price behavior and market structure衡量价格行为与市场结构
Technical analysis studies price, volume, volatility, momentum, and recurring market structure. It does not prove intrinsic value. It describes how participants are behaving and can turn an entry, exit, trend, or risk rule into something observable and testable.
Inputs输入Adjusted prices, volume, timeframe, benchmark, indicators and market events复权价格、成交量、周期、基准、指标与市场事件
Outputs输出Trend state, momentum, support and resistance, signal and invalidation rule趋势状态、动量、支撑阻力、信号与失效规则
Fundamental analysis vs technical analysis: key differences基本面分析与技术分析的核心区别
The cleanest comparison is not “numbers versus charts.” Both can be quantitative. The real differences are the object being studied, the assumptions behind the signal, and the decision horizon.
What is the business or asset plausibly worth?企业或资产可能值多少钱?
What are price and volume doing, and when does the setup fail?价格和成交量如何变化,信号何时失效?
Evidence证据
Statements, earnings, cash flows, balance sheet, industry and economy财务报表、盈利、现金流、资产负债表、行业与经济
Price, volume, volatility, trend, momentum and market structure价格、成交量、波动率、趋势、动量与市场结构
Typical horizon常见周期
Often medium to long term, but earnings events can matter short term通常中长期,但业绩事件也会产生短期影响
Intraday through long-term trend following, depending on timeframe可覆盖日内到长期趋势,取决于所选周期
Common tools常用工具
Margins, ROIC, leverage, free cash flow, DCF and valuation multiples利润率、ROIC、杠杆、自由现金流、DCF和估值倍数
Moving averages, RSI, MACD, price structure, volume and volatility移动平均线、RSI、MACD、价格结构、成交量和波动率
Main weakness主要局限
Estimates depend on accounting quality and uncertain forecasts估计依赖会计质量和不确定的预测
Signals can be noisy, lagging, subjective, or overfit信号可能充满噪声、滞后、主观或过度拟合
Best role最适合的角色
Define quality, value, thesis and fundamental invalidation定义质量、价值、逻辑与基本面失效条件
Define timing, market confirmation and execution risk定义时机、市场确认与执行风险
Which analysis method should you use?应该选择基本面分析还是技术分析?
Choose by the decision, not by identity. A long-term investor may still use technical data to stage entries; a short-term trader still needs to know when earnings or a macro release can invalidate a purely chart-based assumption.
You are deciding what deserves capital你在决定什么值得配置资金
Start with business model, competitive position, accounting quality, balance-sheet resilience, normalized earnings, valuation, and thesis risks. This is especially important when the holding period depends on business outcomes.
Start with liquidity, timeframe, trend state, volatility, price structure, volume confirmation, entry rule, exit rule, and signal invalidation. The method must be specified before observing the outcome.
Use fundamentals to define the research universe and thesis, then technicals to observe market confirmation and manage execution. Keep the two layers separate so a weak chart does not rewrite accounting facts and a favored story does not excuse a broken risk rule.
How to combine fundamental and technical analysis如何结合基本面分析和技术分析
A combined workflow works best when each method has a defined job. Mixing every available indicator into one score hides assumptions and creates false precision.
State universe, benchmark, horizon, liquidity, risk budget and decision date.
记录研究范围、基准、周期、流动性、风险预算和决策日。
02
Build the fundamental thesis建立基本面逻辑
Normalize statements, identify drivers, estimate value range and write explicit risks.
标准化报表、识别驱动因素、估计价值区间并明确记录风险。
03
Read market behavior观察市场行为
Select timeframe, trend and volume rules; avoid changing settings after seeing the signal.
选择周期、趋势和成交量规则,避免看到信号后再调整参数。
04
Plan execution规划执行
Define staging, liquidity assumptions, invalidation, review trigger and maximum exposure.
定义分批方式、流动性假设、失效条件、复核触发器和最大暴露。
05
Audit the decision审计决策
Store data sources, timestamps, transformations, model version and what changed.
保存数据来源、时间戳、转换过程、模型版本和变更内容。
Stock research example: two methods, one evidence trail股票研究案例:两种方法,一条证据链
Assume a fictional company reports improving revenue, stable gross margin, positive free cash flow, moderate leverage, and a valuation below a documented peer range. Its share price remains below a declining long-term moving average on weak volume. This is an illustration, not an investment recommendation.
The company may warrant deeper valuation work公司可能值得继续做估值研究
Improving cash generation and manageable leverage support further work, but peer multiples alone do not establish intrinsic value. Test margins, reinvestment, dilution, cyclicality, and downside assumptions.
The market has not confirmed a trend change市场尚未确认趋势反转
Price below a falling long-term average and weak volume describe current behavior, not company quality. A technical plan could wait for predefined confirmation or use staged execution rather than claiming the valuation is wrong.
Separate thesis, trigger, and risk rule分开记录逻辑、触发器与风险规则
Keep the fundamental thesis and valuation range in one layer; keep technical trigger, position sizing, and invalidation in another. Review both after earnings, material guidance changes, or a defined market-structure break.
Limits and common mistakes in both methods两种分析方法的局限与常见错误
Treating valuation as a precise target把估值当成精确目标价
Intrinsic value is assumption-dependent. Use ranges, scenarios, and sensitivity analysis instead of one unquestioned number.
内在价值依赖假设,应使用区间、情景和敏感性分析,而不是一个不容质疑的数字。
Ignoring accounting quality忽略会计质量
Revenue, earnings, and cash flow can differ in recognition and durability. Reconcile statements and read filing notes.
收入、利润和现金流在确认方式与持续性上可能不同,需要核对报表并阅读附注。
Using indicators without a timeframe不明确周期就使用指标
An RSI or moving average has no useful meaning without instrument, timeframe, parameter, and decision rule.
RSI或移动平均线如果没有证券、周期、参数和决策规则,就缺乏可解释性。
Backtest overfitting回测过度拟合
Repeatedly changing technical rules to fit history can produce fragile signals. Preserve out-of-sample data and include costs.
反复修改技术规则以贴合历史会产生脆弱信号,应保留样本外数据并纳入交易成本。
Letting one method rewrite the other让一种方法改写另一种方法
A price decline does not automatically invalidate business quality; a favored business story does not invalidate a broken execution rule.
价格下跌不会自动否定企业质量,喜爱的企业故事也不能让失效的执行规则重新有效。
Using stale or mismatched data使用陈旧或错配数据
Quarterly statements, intraday prices, adjusted history, and corporate actions have different timestamps. Align them explicitly.
季度报表、日内价格、复权历史和公司行动具有不同时间戳,必须显式对齐。
How QVeris supports a combined research workflowQVeris如何支持组合研究工作流
QVeris can help an agent discover capabilities for financial statements, company metrics, historical prices, volume, filings, and market data; inspect schemas before use; call selected capabilities; and retain provenance. Valuation models and trading rules should remain explicit and deterministic.
Locate statement, filing, price, volume, benchmark and corporate-action capabilities.
查找报表、公告、价格、成交量、基准和公司行动能力。
INSPECT
Verify field meaning核对字段含义
Confirm period, currency, units, adjustment, timezone and missing-value behavior.
确认期间、币种、单位、复权、时区和缺失值行为。
CALL
Retrieve source evidence获取来源证据
Store raw responses separately from normalized statements, ratios and indicators.
把原始响应与标准化报表、比率和指标分开保存。
COMPUTE
Keep logic deterministic保持逻辑确定性
Calculate valuation and technical rules in testable code, not model guesses.
在可测试代码中计算估值和技术规则,不让模型猜测。
AUDIT
Retain provenance保留来源记录
Record provider, fields, parameters, timestamps, transformations and versions.
记录供应商、字段、参数、时间戳、转换和版本。
QVeris does not determine intrinsic value, guarantee signal quality, predict returns, or provide personalized investment advice.
QVeris不负责确定内在价值,不保证信号质量,不预测收益,也不提供个性化投资建议。
FAQ
What is the main difference between fundamental and technical analysis?基本面分析和技术分析最主要的区别是什么?
Fundamental analysis studies business and economic evidence to assess quality and value. Technical analysis studies price, volume, and market behavior to assess trend, timing, and execution conditions.
Which is better: fundamental or technical analysis?基本面分析和技术分析哪个更好?
Neither is universally better. Fundamentals are usually more relevant to business quality and value; technicals are usually more relevant to observed market behavior and execution. The correct choice depends on the decision and horizon.
Can fundamental and technical analysis be used together?基本面和技术面可以结合使用吗?
Yes. A disciplined workflow can use fundamentals for the research universe and thesis, then use technical evidence for confirmation and execution. Keep assumptions and invalidation rules separate.
可以。可用基本面定义研究范围和逻辑,再用技术证据确认并执行,但应分开记录假设和失效规则。
Is fundamental analysis only for long-term investing?基本面分析只适合长期投资吗?
No. It is commonly used for longer horizons, but earnings, guidance, macro data, and valuation changes can also matter over shorter periods.
不是。基本面常用于较长周期,但财报、指引、宏观数据和估值变化也会影响短期价格。
Is technical analysis reliable?技术分析可靠吗?
Reliability depends on a clearly specified rule, suitable data, costs, market regime, and out-of-sample testing. A chart pattern by itself is not a guarantee.
可靠性取决于明确规则、合适数据、成本、市场状态和样本外检验。图表形态本身不构成保证。
Which method should beginners learn first?初学者应该先学哪一种?
Begin with the decision you need to make. Long-term company research benefits from accounting and valuation basics; trading execution benefits from price, volume, risk, and rule-testing basics.
Authoritative references and related QVeris guides权威参考与QVeris相关指南
Charles Schwab explains how investors can use fundamental and technical evidence together. Fidelity describes technical analysis as the study of charts, price, volume, and market behavior, while SEBI Investor contrasts those inputs with financial health and valuation evidence.
Charles Schwab介绍了如何结合基本面与技术证据;Fidelity把技术分析解释为对图表、价格、成交量和市场行为的研究;SEBI Investor则将这些输入与企业财务健康和估值证据进行对比。