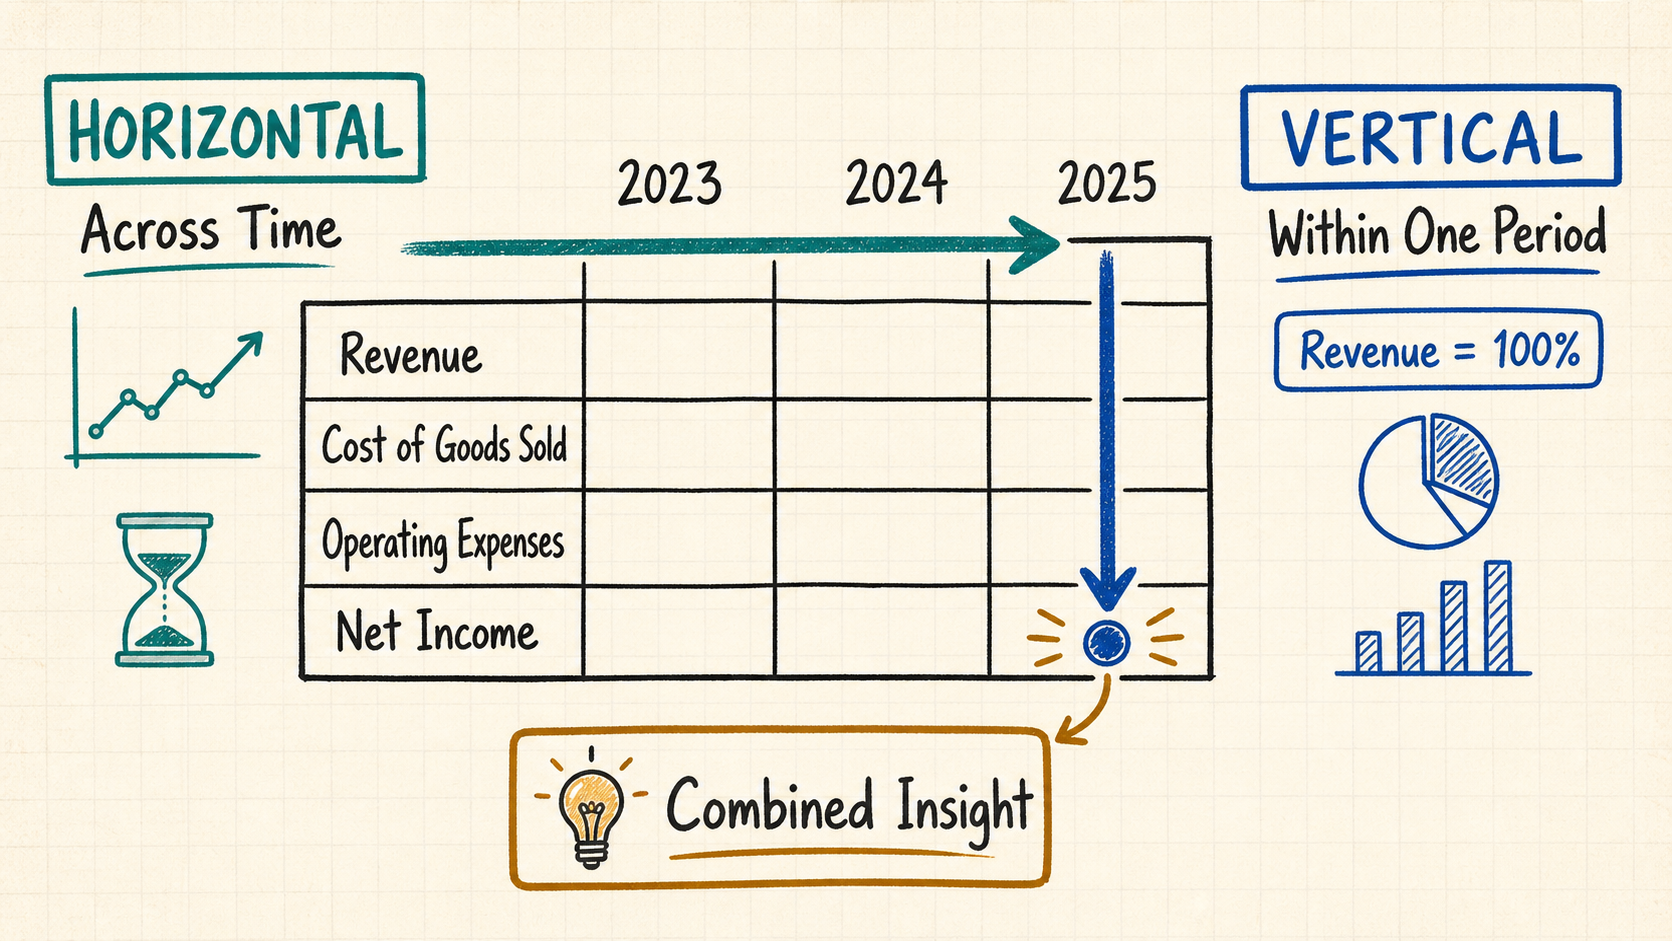
Horizontal vs vertical analysis: the essential difference财务报表横向分析与纵向分析的核心区别
Horizontal analysis, also called trend analysis, moves across reporting periods. It compares the same line item—revenue, inventory, operating income, or cash—from one period to another. Vertical analysis moves within one statement. It converts each line item into a percentage of a selected base, creating a common-size financial statement.
Measures absolute change, percentage change, direction, volatility, and multi-period trend.
衡量绝对变化、百分比变化、方向、波动以及多个期间的趋势。
VS
Vertical纵向分析
Within one period单期内看结构
Measures composition, cost structure, margins, financing mix, and relative scale.
衡量报表构成、成本结构、利润率、融资结构和相对规模。
The methods are complementary rather than competing. Horizontal analysis can reveal that cost of goods sold rose 25%; vertical analysis can reveal that it also consumed a larger share of revenue. The first finding identifies movement. The second explains structural significance.
Horizontal and vertical analysis formulas横向分析与纵向分析计算公式
Use absolute change and percentage change together. A large percentage calculated from a tiny base can look dramatic while being economically small. For vertical analysis, name the denominator explicitly so another analyst can reproduce the result.
Shows the size and direction of movement.表示变化的金额和方向。
Horizontal change %横向变动率
(Current − Base) ÷ Base × 100
Normalizes change against the base period.用基期金额标准化变化。
Vertical common-size %纵向共同百分比
Line item ÷ Statement base × 100
Shows each item's share of the selected base.表示每个项目占所选基准的比例。
How to handle a zero or negative base基期为零或负数时如何处理
Percentage change from zero is undefined. Do not replace it with 100% or an arbitrary number. Report the absolute movement and mark the percentage as not meaningful. A negative base can also reverse the intuitive sign of a percentage; explain the transition in words, especially when a company moves from a loss to a profit.
Worked horizontal and vertical analysis example横向分析与纵向分析完整案例
The following fictional income statement uses simplified figures solely to demonstrate the calculation. Amounts are in millions. It is not a real company, forecast, recommendation, or performance claim.
下面使用虚构且简化的利润表演示计算,金额单位为百万。案例不代表真实公司、预测、投资建议或业绩承诺。
Income statement item利润表项目
2024
2025
Dollar change绝对变化
Horizontal %横向变动率
2024 vertical %2024纵向占比
2025 vertical %2025纵向占比
Revenue收入
1,000
1,200
+200
+20.0%
100.0%
100.0%
Cost of goods sold销售成本
600
750
+150
+25.0%
60.0%
62.5%
Operating expenses营业费用
200
240
+40
+20.0%
20.0%
20.0%
Net income净利润
120
138
+18
+15.0%
12.0%
11.5%
Growth增长Revenue increased 20%, so the top line expanded.收入增长20%,说明业务规模扩大。
Cost pressure成本压力COGS grew faster and rose from 60.0% to 62.5% of revenue.销售成本增速更快,占收入比例由60.0%升至62.5%。
Margin signal利润率信号Net income grew, but its common-size share slipped from 12.0% to 11.5%.净利润金额增长,但占收入比例由12.0%降至11.5%。
Interpret the interaction, not one number解读两种结果的交互,而不是孤立数字
A horizontal-only conclusion might say the business improved because revenue and net income increased. The vertical view adds an important qualification: cost structure deteriorated and net margin compressed. The next research question is not “Did profit rise?” but “Why did input costs, product mix, pricing, or operating leverage prevent profit from keeping pace with revenue?”
Choose the correct base figure for vertical analysis纵向分析如何选择正确的基准项目
Vertical analysis is only meaningful when the base matches the statement and the analytical question. Revenue is conventional for an income statement. Total assets are conventional for the asset side of a balance sheet. Liabilities and equity can be related to total liabilities and equity, which equals total assets under the accounting equation.
State the chosen denominator and why it fits必须说明所选分母及其适用原因
Comparing companies of different sizes比较规模不同的公司
Common-size percentages reduce the effect of absolute company size, making vertical analysis useful for peer comparison. They do not eliminate accounting differences. Align fiscal periods, currencies, consolidation scope, discontinued operations, and line-item definitions before drawing conclusions.
A reproducible financial statement analysis workflow可复算的财务报表分析工作流
Reliable analysis starts before the formulas. It requires consistent periods, units, statement versions, and field definitions. QVeris can support the capability-discovery and data-retrieval steps; the arithmetic should remain explicit and deterministic.
Specify company, statement, annual or quarterly frequency, comparison window, currency, and whether the objective is trend, structure, or peer comparison.
明确公司、报表、年度或季度频率、比较区间、币种,以及目标是趋势、结构还是同行比较。
Retrieve statements获取财报数据
Use QVeris to discover and inspect relevant financial-data capabilities, including FMP statement endpoints where available, then request the needed periods and fields.
通过QVeris发现并检查相关金融数据能力,包括可用的FMP财报接口,再请求所需期间和字段。
Normalize inputs统一输入口径
Align units, signs, fiscal periods, restated figures, and field meaning. Keep missing values distinct from zeros.
统一单位、正负号、财政期间、重述数据和字段含义,并区分缺失值与零值。
Calculate both views计算两种视图
Compute absolute and percentage changes across periods, then compute common-size percentages within each period. Preserve the exact formulas.
计算跨期绝对变化和百分比变化,再计算各期间内部的共同百分比,并保留准确公式。
Investigate drivers追查变化原因
Use filings, notes, segment disclosures, management commentary, and industry context to explain material movements rather than treating percentages as causes.
结合财报附注、分部披露、管理层说明和行业背景解释重大变化,不能把百分比本身当作变化原因。
Retain provenance保留数据来源
Store provider, endpoint, parameters, retrieval time, period, units, formulas, and any exclusions so the analysis can be audited and rerun.
When to use horizontal, vertical, or both analyses什么时候使用横向分析、纵向分析或组合分析
Use horizontal使用横向分析
When the question is about growth, decline, seasonality, trend breaks, unusual movements, or changes before and after an event.
适合分析增长、下降、季节性、趋势拐点、异常波动或某一事件前后的变化。
Use vertical使用纵向分析
When the question is about cost mix, margins, asset composition, leverage, or comparing companies with different absolute sizes.
适合分析成本构成、利润率、资产结构、杠杆,或比较绝对规模不同的公司。
Use both组合使用
When a decision depends on whether growth improved economics, whether a structural shift is persistent, or whether a peer gap is widening.
适合判断增长是否改善经营质量、结构变化是否持续,或与同行的差距是否扩大。
Limitations and common interpretation mistakes局限与常见解读错误
Treating percentages as explanations把百分比当作原因
The calculation shows what moved, not why. Use disclosures and business context to identify drivers.
计算只能显示发生了什么,不能自动说明原因,需要结合披露和经营背景。
Mixing quarterly and annual periods混用季度与年度期间
Seasonality and unequal duration can create false comparisons. Match period length and fiscal timing.
季节性和期间长度差异可能制造错误结论,应统一期间长度与财政时间。
Ignoring restatements忽略报表重述
A later filing may revise prior figures. Use comparable versions and record which statement was retrieved.
后续财报可能修订历史数据,应使用可比版本并记录具体报表来源。
Forcing a zero-base percentage强行计算零基期增长率
Percentage change from zero is undefined. Report the absolute change and explain the transition.
基期为零时增长率无定义,应报告绝对变化并解释状态转换。
Comparing incompatible businesses比较业务模式不同的公司
Common-size statements reduce size effects but do not make banks, software firms, and manufacturers directly comparable.
共同百分比可以减弱规模影响,却不能让银行、软件企业与制造企业直接可比。
Ignoring acquisitions and accounting changes忽略并购与会计政策变化
Structural breaks can reflect consolidation or classification changes rather than organic operating performance.
结构突变可能来自合并范围或分类变化,而不是内生经营表现。
FAQ
What is the difference between horizontal and vertical analysis?财务报表横向分析和纵向分析有什么区别?
Horizontal analysis compares the same item across periods. Vertical analysis expresses items within one period as percentages of a selected base.
横向分析比较同一项目在多个期间的变化;纵向分析把单期报表项目表示为所选基准项目的百分比。
What formulas are used for horizontal and vertical analysis?横向分析和纵向分析的公式是什么?
Horizontal percentage change is (current minus base) divided by base. Vertical percentage is the line item divided by the statement base.
横向变动率为“本期减基期”再除以基期;纵向占比为“报表项目除以所选基准”。
Which base figure should be used for vertical analysis?纵向分析应该选择哪个基准项目?
Revenue is common for an income statement and total assets for a balance sheet. Always state and consistently apply the chosen denominator.
利润表通常选择收入,资产负债表通常选择总资产。必须明确并一致使用所选分母。
Can horizontal and vertical analysis be used together?横向分析与纵向分析可以组合使用吗?
Yes. Use horizontal analysis to find movement, then vertical analysis to determine whether financial structure changed.
可以。先用横向分析识别变化,再用纵向分析判断财务结构是否改变。
What if the horizontal-analysis base value is zero?横向分析的基期金额为零怎么办?
Do not calculate a percentage. Report the absolute movement, mark the percentage as not meaningful, and explain the business event.
不要计算百分比,应报告绝对变化,把比例标记为无意义,并说明相关业务事件。
Which method is better for comparing companies of different sizes?比较规模不同的公司应该使用哪种方法?
Vertical common-size analysis is usually more useful, provided accounting definitions, periods, currencies, and business models are reasonably comparable.
纵向共同百分比分析通常更合适,但前提是会计定义、期间、币种和业务模式具有合理可比性。
Authoritative references权威参考资料
The formulas and definitions on this page are consistent with educational materials from OpenStax, CFA Institute, and AccountingTools. These links support the accounting concepts; they do not endorse QVeris or the fictional example.