
LLM Gateway Observability
Logs Tell What; Traces Explain Why
LLM 网关可观测性:日志说明结果,调用链解释原因
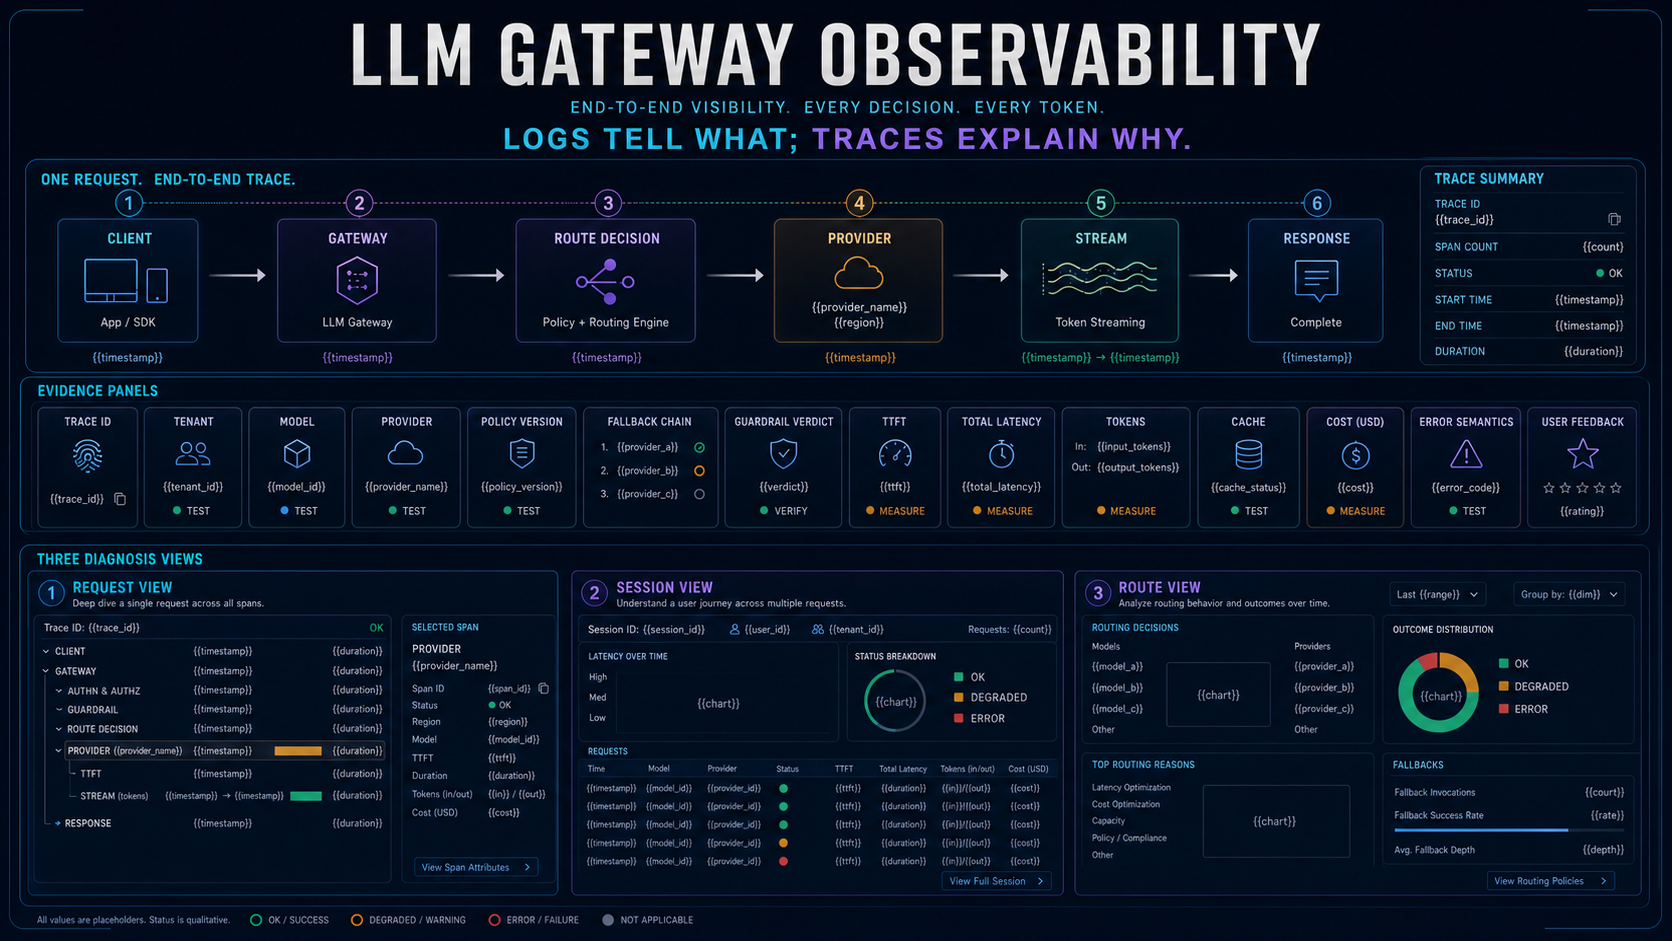
Gateway observability should reconstruct a model request from client to route decision, provider, stream and response. The valuable unit is not a dashboard chart; it is evidence that shortens a production decision or incident.
网关可观测性应能重建从客户端、路由决策、供应商、流式到响应的模型请求。真正有价值的单位不是仪表盘图表,而是能缩短生产决策或事故处理的证据。
TL;DR
Join identity, payload metadata, route policy, provider, model, guardrail, stream, usage, latency, cost and error spans.
Group requests, tool calls, feedback and user outcomes without losing per-request provenance.
Compare eligible candidates, selected route, fallback reasons and outcomes over time by workload and policy version.
Redaction, sampling, retention, access, regional storage, export and deletion determine whether rich telemetry is safe and useful.
连接身份、请求数据元数据、路由策略、供应商、模型、护栏、流、用量、延迟、成本与错误追踪片段。
在不丢失单请求来源的情况下,组合请求、工具调用、反馈与用户结果。
按工作负载与策略版本比较合格候选、所选路由、回退原因与长期结果。
脱敏、采样、保留、访问、区域存储、导出与删除决定丰富遥测是否安全有用。
Observability products emphasize different questions 可观测产品强调不同问题
Gateway suites combine routing controls with traffic evidence. Observability-first platforms center traces, sessions, prompts, evaluations and feedback. General telemetry stacks accept OpenTelemetry signals but need AI-specific semantic conventions and product workflows.
网关套件把路由控制与流量证据结合;可观测优先平台以调用链、会话、提示词、评估与反馈为中心;通用遥测栈接收 OpenTelemetry 信号,但需要 AI 特定语义约定与产品工作流。
No dashboard can compensate for missing identifiers or transformations. Capture trace context at the client, preserve it through every proxy and provider adapter, record route decisions before execution, and correlate user outcomes after response.
缺失标识或转换无法靠仪表盘弥补。应在客户端捕获调用链上下文,使其穿过每个代理与供应商适配器,在执行前记录路由决策,并在响应后关联用户结果。
Observability approaches 可观测实现方式
| Approach 方式 | Best fit 最适合 | Verify before choosing 选择前验证 |
|---|---|---|
| Gateway-integrated evidence 网关集成证据 | One system owns routing and records selected provider, fallback, guardrails, usage and cost. 同一系统负责路由,并记录所选供应商、回退、护栏、用量与成本。 | Verify export, retention, session grouping, evaluations, feedback and independence from the synchronous path. 验证导出、保留、会话分组、评估、反馈及与同步路径的解耦。 |
| Observability-first platform 可观测优先平台 | Deep developer workflows for requests, traces, sessions, prompts, scores, cost and feedback. 提供请求、调用链、会话、提示词、评分、成本与反馈的深入开发工作流。 | Clarify how routing policy and gateway decisions are captured and whether another proxy adds duplicate retries. 明确如何捕获路由策略与网关决策,以及另一代理是否增加重复重试。 |
| OpenTelemetry pipeline OpenTelemetry 管线 | Vendor-neutral collection into existing metrics, logs and traces with enterprise operations. 以供应商中立方式把指标、日志与调用链收集到现有企业运营体系。 | Define AI semantic fields, sensitive-data policy, evaluation joins and product-specific incident views. 定义 AI 语义字段、敏感数据策略、评估关联与产品特定事故视图。 |
| Warehouse analytics 数据仓库分析 | Flexible long-term analysis across usage, cost, experiments, quality and business outcomes. 跨用量、成本、实验、质量与业务结果提供灵活长期分析。 | Streaming diagnosis may be slow; preserve request-level IDs, schema, freshness and source-of-truth rules. 实时诊断可能较慢;需保留请求级 ID、结构定义、新鲜度与事实来源规则。 |
| Application-only logging 应用内日志 | Fast to start and fully customized for one product. 起步快,可针对单一产品完全定制。 | Provider changes, sessions, tools, fallback and cross-team governance become fragmented as the stack grows. 技术栈增长后,供应商变化、会话、工具、回退与跨团队治理会碎片化。 |
Four evidence contracts 四类证据契约
Trace, request, session, tenant, user, workload, experiment, prompt/version and policy identifiers.
Eligible candidates, scores, selected model/provider/endpoint, route reason, retries, fallback, cache and guardrails.
TTFT, total latency, stream events, input/output/reasoning/cache tokens, native usage, normalized cost and provider receipt.
Schema validity, tool success, evaluation, feedback, business result, sampling, redaction, retention, access and deletion.
调用链、请求、会话、租户、User、工作负载、Experiment、提示词/Version 与 Policy ID。
合格候选、评分、所选模型/供应商/端点、路由原因、重试、回退、缓存与护栏。
TTFT、总延迟、流事件、输入/输出/Reasoning/缓存 Token、原生用量、标准化成本与供应商回执。
结构定义有效性、工具成功、评估、反馈、业务结果、采样、脱敏、保留、访问与删除。
Use the broken-session test 使用故障会话测试
- Instrument one workload end to end and verify trace continuity across client, gateway, provider and application response.
- Inject timeout, 429, malformed stream, guardrail denial, schema failure and provider fallback.
- Give engineers only the observability system and time detection, reconstruction, root cause and verified recovery.
- Reconcile request counts, usage and cost against provider records; test export, redaction, deletion and access review.
- 对一个负载做端到端埋点,验证调用链在客户端、网关、供应商与应用响应间连续。
- 注入超时、429、流格式错误、护栏拒绝、结构定义失败与供应商回退。
- 只提供可观测系统给工程师,计时发现、重建、根因与恢复验证。
- 用供应商记录核对请求数、用量与成本,并测试导出、脱敏、删除与访问评审。
Capture decisions before effects 在效果发生前捕获决策
Create spans for authentication, eligibility, scoring, route decision, provider attempt, stream, guardrail and response. Freeze policy inputs and candidate scores at decision time. Carry trace context through provider metadata where supported and map native request IDs back into the gateway trace. Send telemetry asynchronously with bounded buffers and a safe failure mode.
为认证、资格、评分、路由决策、供应商尝试、流、护栏与响应创建追踪片段。决策时冻结策略输入与候选评分;在支持时通过供应商元数据携带调用链上下文,并把原生请求 ID 映射回网关调用链。遥测应异步发送,使用有界缓冲与安全故障模式。
Production rule: if the evidence cannot reproduce why a route happened, the system is monitoring traffic but not observing decisions.
生产规则:如果证据无法重现路由为何发生,系统只是在监控流量,而不是观测决策。
Extend traces from inference into external action 让调用链从推理延伸到外部行动
Gateway traces explain the model call. QVeris adds search_id, execution_id, capability contract, estimated cost, downstream latency and result for external APIs and tools. Propagate one workflow trace so the team can connect reasoning evidence to action evidence.
网关调用链解释模型调用;QVeris 为外部 API 与工具增加 search_id、execution_id、能力契约、预估成本、下游延迟与结果。传播同一工作流调用链,把推理证据连接到行动证据。
The Production Operating Model for LLM gateway observabilityLLM Gateway 可观察性的生产运营模型
For LLM Gateway Observability, reliability begins when reliable only when requirements, policy, failure behavior, evidence, and ownership are explicit. Turn the diagram into an operating contract that can be tested before launch and during every change.
针对“LLM 网关可观测性”,只有当需求、策略、失败行为、证据和责任都明确时,架构才会真正可靠。应把架构图转成运营契约,并在上线前和每次变更期间持续测试。
Inventory request and trace IDs, user and tenant, prompt and policy versions, resolved route, provider attempt, transformations, streaming milestones, token classes, cost, evaluation, and downstream tool effects. For each workflow, set quality, availability, p50 and tail latency, freshness, privacy, regional, cost, and recovery objectives instead of applying one global policy.
盘点请求与 Trace ID、用户与租户、提示词和策略版本、解析路由、供应商尝试、转换、流式里程碑、Token 类别、成本、评估和下游工具效果。为每类工作流分别设置质量、可用性、常规与长尾延迟、新鲜度、隐私、区域、成本和恢复目标,而不是套用一个全局策略。
For LLM Gateway Observability, first reject routes that fail capability, authorization, residency, safety, health, or budget constraints. Only then optimize among eligible candidates. Version the policy and record the reason for every decision and override.
针对“LLM 网关可观测性”,先排除不满足能力、授权、驻留、安全、健康或预算约束的路由,再在合格候选项中优化。版本化策略,并记录每次决策与覆盖的原因。
To validate LLM Gateway Observability, inject rate limits, slow streams, malformed output, stale control data, credential loss, regional failure, quota exhaustion, schema drift, and dependent-tool outages. Verify bounded retries, semantic fallback, partial results, and safe recovery.
验证“LLM 网关可观测性”时,注入限流、慢速流、畸形输出、过期控制数据、凭证丢失、区域故障、配额耗尽、Schema 漂移和依赖工具中断,验证有界重试、语义故障切换、部分结果和安全恢复。
When operating LLM Gateway Observability, trace request, policy version, candidate set, selected route, transformations, attempts, latency, usage, cost, validation, and final task result. Tie alerts to runbooks, assign owners, and use incidents to update tests and acceptance thresholds.
运营“LLM 网关可观测性”时,追踪请求、策略版本、候选集合、所选路由、转换、尝试、延迟、用量、成本、校验和最终任务结果,把告警连接到运行手册,明确负责人,并用事故更新测试与验收门槛。
FAQ
At minimum identity, trace, route policy, model/provider, attempts, errors, latency, usage and cost—with governed payload handling.
Use logs for discrete events and traces for causality across components and attempts. Metrics summarize fleet behavior.
Only under explicit data classification, redaction, consent, access, regional, retention and deletion policy.
至少记录身份、调用链、路由策略、模型/供应商、尝试、错误、延迟、用量与成本,并治理请求数据。
日志记录离散事件,调用链表达跨组件与尝试的因果关系,指标汇总整体行为。
只有在明确的数据分类、脱敏、同意、访问、区域、保留与删除策略下才应存储。