
Portfolio return组合收益率
rₚ = wᵀr
Multiply each asset return by its portfolio weight. Decide whether weights are start-of-period, end-of-period, or rebalanced; the choice affects the series.
用每项资产收益率乘以组合权重。必须明确使用期初、期末还是再平衡权重,因为口径会改变结果。
Portfolio risk analysis connects holdings, weights, returns, correlation, concentration, drawdown, and stress scenarios so you can identify what drives risk instead of trusting one score.
投资组合风险分析把持仓、权重、收益率、相关性、集中度、最大回撤与压力情景连接起来,帮助你定位风险来源,而不是依赖单一分数。
A useful analysis does not ask whether a portfolio is simply “safe” or “risky.” It asks which losses matter, over what horizon, relative to which benchmark or liability, and what decision will follow. The same holdings can look acceptable under monthly volatility and unacceptable under a one-week liquidity shock.
有用的分析不是简单判断组合“安全”或“危险”,而是明确关心哪类损失、观察多长周期、相对哪个基准或负债,以及结果将支持什么决策。同一组持仓在月度波动率下可能正常,在一周流动性冲击下却可能不可接受。
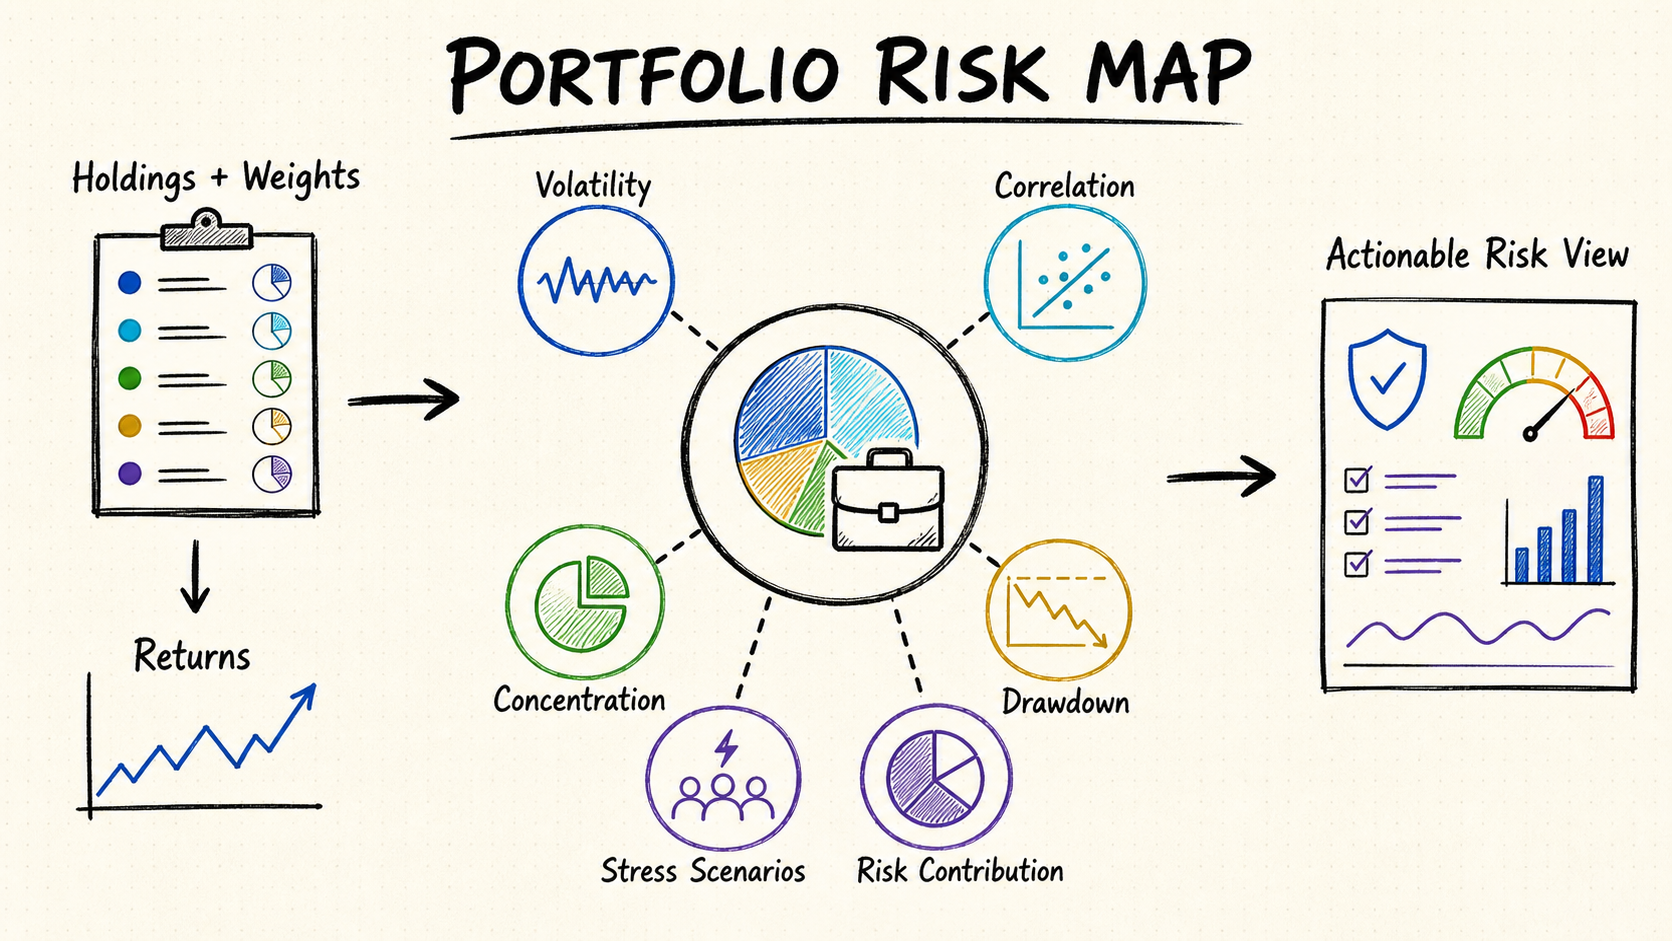
No single metric captures every form of risk. Volatility describes dispersion, drawdown describes the path of loss, and a stress test asks what could happen under a specified shock. Use a small set whose assumptions match the decision.
没有一个指标能覆盖全部风险。波动率描述收益离散程度,最大回撤描述亏损路径,压力测试则回答特定冲击下可能发生什么。应选择一组与决策假设相匹配的指标。
Start with the decision on the left, then read across to the metric family. The output is evidence for review—not a prediction or an automatic buy/sell instruction.
先从左侧决策问题出发,再选择对应指标族。输出只是用于复核的证据,不是预测,也不是自动买卖指令。
A position’s standalone volatility is not its portfolio risk contribution. Portfolio variance depends on weights and every pairwise covariance. That is why adding a volatile asset can sometimes reduce total volatility if its correlation with the rest is sufficiently low.
单个资产的波动率并不等于它对组合的风险贡献。组合方差取决于权重和所有资产之间的协方差,因此当某个高波动资产与其他持仓相关性足够低时,加入它反而可能降低总波动率。
Multiply each asset return by its portfolio weight. Decide whether weights are start-of-period, end-of-period, or rebalanced; the choice affects the series.
用每项资产收益率乘以组合权重。必须明确使用期初、期末还是再平衡权重,因为口径会改变结果。
Here Σ is the variance-covariance matrix. Use aligned return dates and a stable estimation method; a noisy or singular matrix can make risk estimates unstable.
Σ为方差协方差矩阵。应对齐收益日期并使用稳定估计方法;噪声过大或奇异矩阵会让风险估计不稳定。
Component contributions sum to total volatility under this framework. A small position may contribute substantial risk when its volatility and covariance are high.
在该框架下,各成分风险贡献之和等于总波动率。权重较小的持仓如果波动率和协方差较高,仍可能贡献大量风险。
Interpretation guardrail: historical covariance is an estimate, not a constant. Correlations can change across regimes, so report the data window and test alternative windows or stressed correlations.
解释边界:历史协方差只是估计值,并非常数。相关性会随市场状态变化,因此应记录数据窗口,并测试不同窗口或压力相关性。
Consider a fictional research portfolio with 45% broad equities, 20% technology equities, 20% government bonds, 10% gold, and 5% cash. These weights are illustrative, not a recommendation. The task is to diagnose structure before calculating a final score.
假设一个虚构研究组合包含45%宽基股票、20%科技股、20%政府债券、10%黄金和5%现金。这些权重仅用于说明,不构成推荐。任务是在计算最终分数前先诊断结构。
The broad-equity sleeve may already contain large technology positions. Adding a separate technology sleeve can create hidden sector and factor concentration even though the portfolio lists five categories.
宽基股票本身可能已包含大量科技公司,再叠加独立科技股,会形成隐藏的行业与因子集中,即使表面上组合包含五类资产。
A 20% technology allocation can contribute more than 20% of total volatility if its volatility and covariance with broad equities are high. Bonds or gold can contribute less risk than their weights suggest when their covariance is low.
如果科技股波动率较高,且与宽基股票协方差较大,20%的配置可能贡献超过20%的总波动率;债券或黄金在低协方差下,风险贡献可能低于资金权重。
A full-period correlation matrix can hide regime changes. Review rolling correlations and a stress-period matrix to see whether diversifiers continued to diversify when equities fell.
全样本相关性矩阵可能掩盖市场状态变化。应检查滚动相关性和压力期矩阵,判断股票下跌时分散资产是否仍发挥作用。
Portfolio volatility can be moderate while a concentrated sleeve experiences a deep drawdown. Track peak-to-trough loss, time under water, and which holdings dominated the decline.
组合波动率可能中等,但某个集中资产组仍会经历深度回撤。需要同时记录峰谷跌幅、水下时间以及主导下跌的持仓。
The result is not “sell technology.” It is a documented question: does the observed technology and growth-factor concentration fit the portfolio mandate, loss budget, liquidity needs, and benchmark?
结论不是“卖出科技股”,而是一个可记录的问题:当前科技与成长因子集中度,是否符合组合授权、亏损预算、流动性需求和基准?
Historical statistics answer what occurred in the selected sample. Scenario analysis asks how the current holdings would respond to a defined shock. Use transparent assumptions and avoid presenting a scenario loss as a forecast.
历史统计回答选定样本中发生过什么,情景分析则估计当前持仓在指定冲击下如何反应。应公开假设,不要把情景亏损表述为预测。
Shock equity sleeves, widen volatility, and increase correlations among risk assets. This tests whether apparent ticker diversification collapses into one shared factor.
对股票资产施加下跌冲击,提高波动率与风险资产间相关性,用于检验表面的股票数量分散是否会坍缩为单一共同因子。
Ask: which positions dominate loss and component risk?
关注:哪些持仓主导亏损与风险贡献?
Apply parallel and non-parallel yield-curve shifts where duration data allow. Include rate-sensitive equities and financing exposures rather than isolating the bond sleeve.
在久期数据允许时测试收益率曲线平行与非平行移动,并纳入利率敏感股票和融资暴露,而不是只冲击债券部分。
Ask: is duration hidden outside fixed income?
关注:固定收益之外是否存在隐藏久期?
Revalue foreign holdings after both local-asset moves and FX moves. State whether returns are hedged, unhedged, or partially hedged and keep base-currency conversion consistent.
同时考虑海外资产本地价格变化与汇率变化。说明收益是已对冲、未对冲还是部分对冲,并保持基础货币换算一致。
Ask: how much risk comes from asset versus currency?
关注:风险来自资产本身还是汇率?
Widen bid-ask assumptions, reduce executable size, and flag assets with infrequent prices. A low measured volatility can reflect stale marks rather than genuinely low risk.
扩大买卖价差假设、降低可执行规模,并标记低频定价资产。测得的低波动可能来自陈旧估值,而不是真正的低风险。
Ask: can the portfolio rebalance within the decision horizon?
关注:组合能否在决策周期内完成再平衡?
A sophisticated model cannot rescue inconsistent identifiers, missing corporate-action adjustments, stale weights, or mixed currencies. Treat data contracts and provenance as part of the risk model.
再复杂的模型也无法修复错误标识符、缺失的公司行动调整、过期权重或混合币种。数据契约与来源记录本身就是风险模型的一部分。
Freeze holdings, quantities, prices, cash, derivatives, liabilities, and the valuation timestamp. Decide whether the analysis reflects an actual, model, or proposed portfolio.
固定持仓、数量、价格、现金、衍生品、负债与估值时间戳,并说明分析对象是真实组合、模型组合还是拟议组合。
Map ticker, exchange, security identifier, share class, currency, and corporate actions. For funds, record whether sector and constituent exposure is available and from which date.
映射股票代码、交易所、证券标识、股份类别、币种与公司行动。对基金还应记录是否获得行业和成分穿透数据及其日期。
Use adjusted prices or explicit distributions, a consistent base currency, and a documented trading calendar. Do not convert missing observations into zero returns without justification.
使用复权价格或显式分红数据,统一基础币种和交易日历。未经论证,不要把缺失观察值直接转换为零收益。
Record return frequency, lookback window, annualization factor, covariance estimator, risk-free rate, benchmark, VaR method, confidence level, and holding period.
记录收益频率、回看窗口、年化因子、协方差估计器、无风险利率、基准、VaR方法、置信度和持有期。
Keep formulas in testable code or a controlled spreadsheet. Validate that weights reconcile, covariance is usable, component contributions add up, and outputs remain stable under small data changes.
把公式保留在可测试代码或受控表格中。验证权重能否对账、协方差矩阵是否可用、成分贡献能否加总,以及小幅数据变化下结果是否稳定。
Vary lookback windows, correlation assumptions, benchmark choice, volatility regime, and liquidity haircuts. Separate observed historical statistics from hypothetical scenario outputs.
调整回看窗口、相关性假设、基准选择、波动状态和流动性折价,并清楚区分历史统计与假设情景输出。
Store source, field name, transformation, currency, timestamp, model version, parameters, warnings, and missing-data decisions so another analyst or agent can reproduce the analysis.
保存来源、字段名、转换过程、币种、时间戳、模型版本、参数、警告和缺失值决策,让其他分析师或Agent能够复算。
Standard deviation counts upside and downside dispersion. Pair it with drawdown, downside deviation, and scenarios when the decision concerns capital loss.
标准差同时计算上涨和下跌离散度。关注资本损失时,应结合最大回撤、下行偏差和情景分析。
Full-sample correlations can conceal stress convergence. Review rolling estimates and stressed matrices without pretending either is certain.
全样本相关性可能掩盖压力期趋同。应同时检查滚动估计与压力矩阵,但不要把任何一种视为确定事实。
Multiple funds can own the same securities or factors. Use look-through holdings, sector exposure, geography, duration, and factor analysis.
多个基金可能持有相同证券或因子。需要穿透检查持仓、行业、地区、久期与因子暴露。
VaR is a quantile, not the maximum loss beyond the threshold. Report Expected Shortfall or scenario losses and disclose method assumptions.
VaR是分位数,不是超过阈值后的最大亏损。应补充预期损失或情景亏损,并披露方法假设。
End-of-period weights can embed price moves into a historical calculation. State the rebalancing rule and avoid look-ahead bias.
期末权重可能把价格变化嵌入历史计算。应明确再平衡规则并避免前视偏差。
Infrequent marks can suppress measured volatility and correlation. Flag stale observations and consider liquidity or appraisal-based adjustments.
低频估值会压低测得的波动率和相关性。应标记陈旧观察,并考虑流动性或估值型调整。
Covariance estimates are uncertain, especially with many assets and short histories. Use constraints, shrinkage, sensitivity tests, and out-of-sample review where appropriate.
当资产数量多、历史样本短时,协方差估计尤其不稳定。可酌情使用约束、收缩估计、敏感性测试与样本外检验。
A changed data vendor, window, benchmark, or formula can move risk without any trade. Keep a versioned calculation contract and change log.
即使没有交易,数据供应商、窗口、基准或公式变化也会改变风险结果。应保留版本化计算契约与变更记录。
QVeris can help an agent discover and call relevant market-data capabilities, inspect schemas, and retain an auditable capability trail. Portfolio weights, covariance, VaR, risk contribution, and scenarios should still be calculated in a deterministic layer with explicit assumptions.
QVeris可以帮助Agent发现并调用相关市场数据能力、检查数据模式并保留可审计的能力调用记录。组合权重、协方差、VaR、风险贡献与情景分析仍应在确定性计算层完成,并明确披露假设。
Search for adjusted prices, benchmarks, holdings, corporate actions, fundamentals, and macro or rate series relevant to the chosen risk question.
查找与风险问题相关的复权价格、基准、持仓、公司行动、基本面及宏观或利率序列。
Confirm symbol scope, timestamp, timezone, adjustment method, currency, frequency, missing-value behavior, and provider limitations.
确认证券范围、时间戳、时区、复权方法、币种、频率、缺失值行为及供应商限制。
Call selected capabilities, validate response shape, and store raw fields separately from transformed returns and risk measures.
调用选定能力,验证响应结构,并把原始字段与转换后的收益率和风险指标分开保存。
Record provider, capability, parameters, retrieval time, transformations, warnings, and calculation version so results can be reproduced.
记录供应商、能力、参数、获取时间、转换、警告和计算版本,以便结果能够复算。
QVeris is a capability-access layer, not a portfolio manager. It does not guarantee data completeness, predict returns, set risk limits, or provide personalized investment advice.
QVeris是能力访问层,不是投资组合管理人。它不保证数据完整性,不预测收益、不设定风险限额,也不提供个性化投资建议。
It is the structured evaluation of how holdings and their relationships create potential variability and loss. A complete review covers exposure, volatility, correlation, concentration, drawdown, downside metrics, risk contribution, and scenarios.
它系统评估持仓及其相互关系如何形成潜在波动与亏损。完整复核应覆盖暴露、波动率、相关性、集中度、最大回撤、下行指标、风险贡献与情景分析。
Define the decision and horizon, freeze holdings and weights, align total-return data, examine concentration, calculate covariance-based volatility, add drawdown and downside measures, decompose contributors, run scenarios, and document assumptions.
先定义决策与周期,固定持仓和权重,对齐总收益数据,检查集中度,计算基于协方差的组合波动率,补充回撤与下行指标,分解风险贡献,执行情景测试并记录假设。
Common lenses include volatility, covariance, correlation, beta, tracking error, downside deviation, maximum drawdown, VaR, Expected Shortfall, concentration, factor exposure, and component risk contribution. Select metrics by the decision, not popularity.
常见视角包括波动率、协方差、相关性、贝塔、跟踪误差、下行偏差、最大回撤、VaR、预期损失、集中度、因子暴露和成分风险贡献。应按决策选择,而不是按流行度选择。
Correlation determines how returns move together. Lower correlations can reduce portfolio variance, but relationships are estimated and can rise in stress. Review rolling and stressed correlations rather than relying on one matrix.
相关性决定资产收益如何共同变化。较低相关性可以降低组合方差,但相关关系只是估计值,并可能在压力期上升,因此应检查滚动相关性和压力相关性。
No. It can reduce idiosyncratic and concentration risk, but market-wide, liquidity, model, currency, and tail risks remain. Diversification also weakens when supposedly different holdings share the same underlying factor.
不能。分散化可以降低特有风险和集中度风险,但系统性、流动性、模型、汇率与尾部风险仍然存在;当不同持仓共享同一底层因子时,分散效果也会减弱。
It estimates how much each holding or factor adds to total risk after accounting for weight, volatility, and covariance. It is more informative than weight alone because small positions can be large risk drivers.
它估计每个持仓或因子在考虑权重、波动率与协方差后对总风险的增量。它比单独看权重更有解释力,因为小持仓也可能成为大风险来源。
No. VaR identifies a loss quantile for a stated horizon and confidence level; it does not describe the worst loss beyond that threshold. Pair it with Expected Shortfall, stress tests, and clear model assumptions.
不是。VaR给出特定周期和置信度下的亏损分位数,并不描述超过阈值后的最坏亏损。应结合预期损失、压力测试和明确的模型假设。
Match cadence to strategy, liquidity, and governance. Re-run after material price moves, cash flows, rebalancing, benchmark or mandate changes, and data-model changes. Avoid reacting mechanically to every daily fluctuation.
频率应匹配策略、流动性与治理要求。重大价格变化、现金流、再平衡、基准或授权变化,以及数据模型变化后都应重新分析,但不应机械追逐每日波动。
CFA Institute explains how weights, standard deviations, covariance, correlation, and diversification determine portfolio risk. Investor.gov describes diversification and asset allocation, while FINRA outlines how concentration can arise across a portfolio.
CFA Institute说明了权重、标准差、协方差、相关性与分散化如何共同决定组合风险;Investor.gov介绍资产配置和分散化;FINRA则说明组合集中度风险可能如何形成。