
Price to Earnings Ratio Explained
Read the Multiple, Not Just the Number市盈率P/E完整解释
理解倍数,而不只是记住数字
Price to earnings ratio explained from first principles: calculate P/E, choose the correct EPS period, interpret high or low multiples, and know when negative earnings make it unusable.
市盈率P/E从基础逻辑解释:正确计算倍数、选择一致的每股收益期间、判断高低市盈率,并识别负盈利使该指标失去意义的情况。
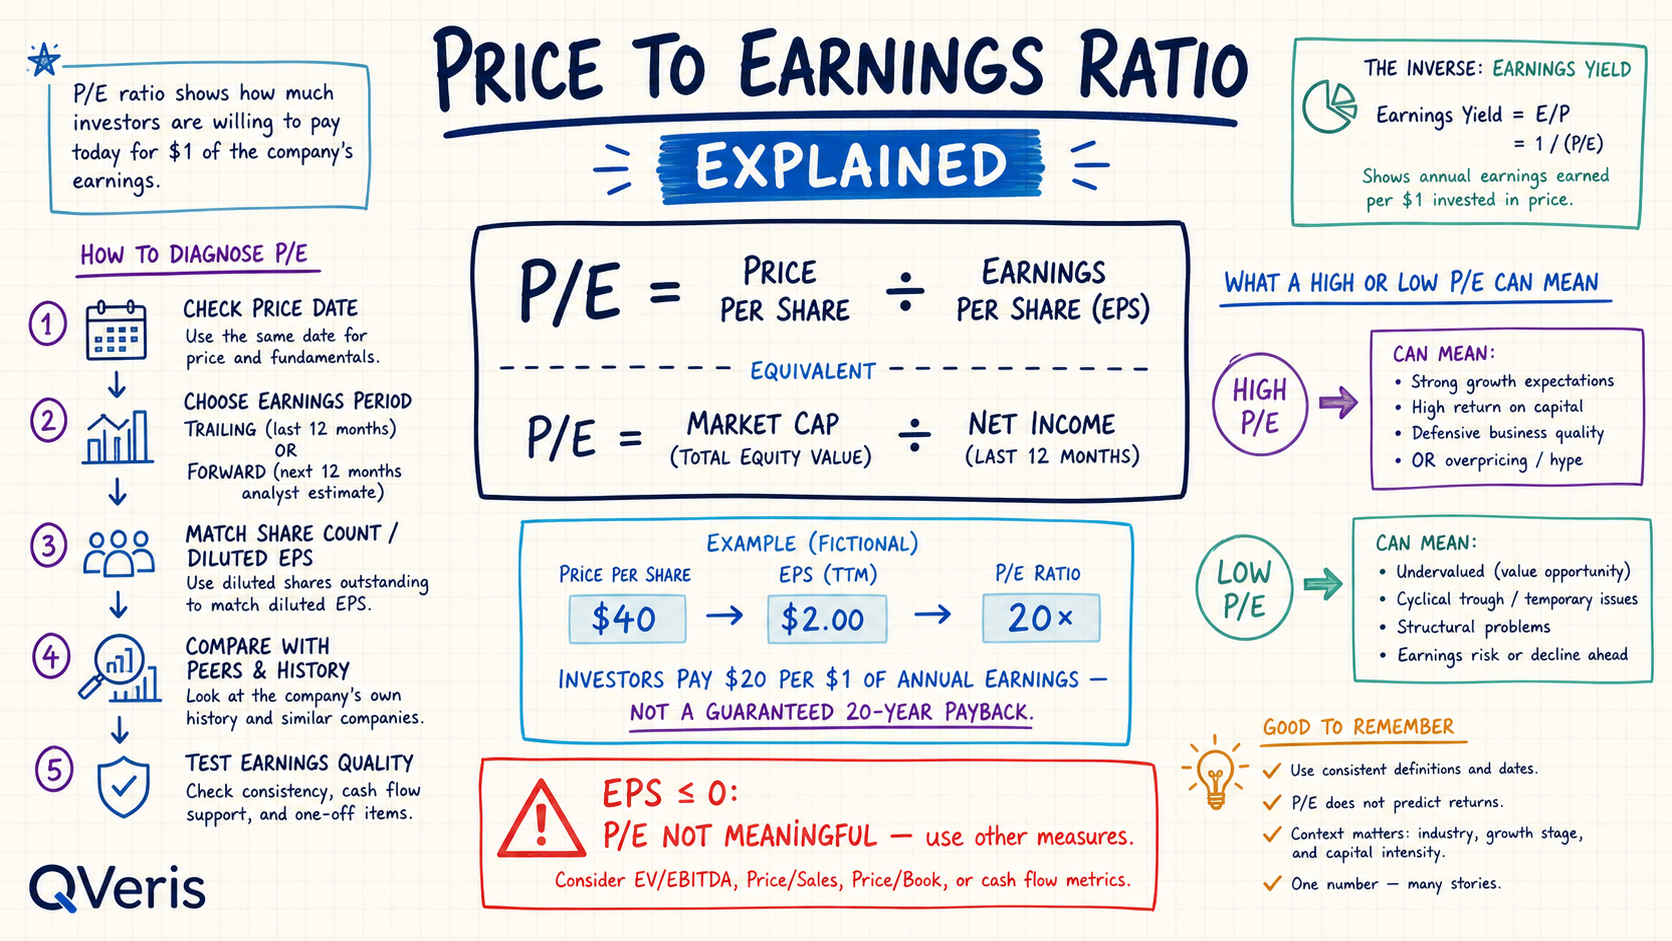
Price to earnings ratio explained: what P/E means市盈率P/E解释:这个估值倍数是什么意思
The price-to-earnings ratio compares the market value of common equity with the earnings attributable to common shareholders. On a per-share basis, it divides the current share price by earnings per share. A P/E of 20× means the market price equals 20 units for every one unit of annual earnings represented by the chosen EPS period.
市盈率把普通股市场价值与归属于普通股股东的盈利进行比较。按每股口径,它等于当前股价除以每股收益。20倍市盈率表示:针对所选盈利期间,每1单位年度盈利对应20单位市场价格。
It does not mean investors are guaranteed to recover their purchase price in 20 years. Earnings can grow, shrink, turn negative, be retained, or be distributed; the share price also changes. P/E is a relative valuation multiple, not a cash-payback schedule or return forecast.
它并不表示投资者保证在20年收回买价。盈利可能增长、下降、转亏、留存或分配,股价也会变化。市盈率是相对估值倍数,不是现金回收期,更不是收益预测。
Price to earnings ratio formula and equivalent forms市盈率计算公式与等价形式
The two forms should agree when the share count, income attribution, period, and dilution basis are consistent. Use diluted EPS when evaluating the economic effect of options, restricted shares, or convertible instruments, and match it with an appropriate price and share definition.
当股份数量、利润归属、期间与稀释口径一致时,两种形式应当相符。若要评估期权、限制性股票或可转换工具的经济影响,应使用稀释每股收益,并匹配适当的价格与股份定义。
P/E ratio calculation example市盈率计算案例
Assume a fictional company trades at $40 per share and reports trailing diluted EPS of $2.00. The calculation is simple, but the label must preserve the period and dilution basis.
假设一家虚构公司的股价为40美元,过去十二个月稀释每股收益为2美元。计算本身很简单,但结果标签必须保留期间与稀释口径。
The result says investors currently price the stock at $20 for each $1 of trailing diluted earnings. It does not establish fair value. The analyst still needs to assess earnings quality, future growth, capital needs, financial risk, and whether comparable companies use the same definitions.
结果表示市场目前为每1美元过去十二个月稀释盈利支付20美元,但这不能直接证明公允价值。分析师仍需检查盈利质量、未来增长、资本需求、财务风险,以及可比公司是否使用一致定义。
How to interpret a high or low P/E ratio如何解读高市盈率和低市盈率
A high P/E can reflect expected growth, durable margins, lower perceived risk, capital-light economics, or an overoptimistic price. A low P/E can reflect undervaluation, mature growth, cyclically high earnings, balance-sheet risk, deteriorating economics, or a temporary event. The multiple alone cannot distinguish these stories.
高市盈率可能反映增长预期、稳定利润率、较低感知风险、轻资产模式,也可能来自价格过度乐观。低市盈率可能反映低估、成熟增长、周期高点盈利、资产负债表风险、经营恶化或暂时事件。单一倍数无法区分这些故事。
High P/E questions高市盈率需要追问
- What growth and margin assumptions are embedded?价格隐含怎样的增长与利润率?
- Are returns on capital durable?资本回报是否可持续?
- How sensitive is value to disappointment?估值对不及预期有多敏感?
Low P/E questions低市盈率需要追问
- Are current earnings near a cyclical peak?当前盈利是否处于周期高点?
- Is debt or dilution understated?债务或稀释是否被低估?
- Is the apparent discount a value trap?表面折价是否是价值陷阱?
What is a good P/E ratio?市盈率多少才合理?
There is no universal good P/E. Compare companies with similar business models, geography, accounting, capital intensity, leverage, growth, and earnings periods. Then compare the company with its own history, while checking whether the business mix or interest-rate environment changed. A lower number is not automatically cheaper in economic terms.
不存在适用于所有股票的合理市盈率。应比较商业模式、地区、会计、资本密集度、杠杆、增长与盈利期间相似的公司,再与公司自身历史比较,同时检查业务结构或利率环境是否变化。数字更低并不自动等于经济意义上更便宜。
Trailing, forward, and fiscal P/E definitions滚动、预测与财年市盈率口径
| Type类型 | Denominator分母 | Strength优点 | Main caution主要注意 |
|---|---|---|---|
| Trailing P/E滚动市盈率 | Last 12 months EPS过去12个月EPS | Observed reported history基于已报告历史 | May be stale or cyclical可能滞后或受周期影响 |
| Forward P/E预测市盈率 | Expected future EPS未来预期EPS | Aligns price with expected earnings把价格与未来盈利匹配 | Estimate error and revisions预测误差与修正 |
| Fiscal-year P/E财年市盈率 | Specified annual EPS指定财年EPS | Clear reporting label报告标签明确 | Price date may not align价格日期可能不匹配 |
See the dedicated forward P/E vs trailing P/E comparison查看预测市盈率与滚动市盈率专项比较.
Negative P/E and other limitations负市盈率与其他局限
Earnings quality盈利质量
One-time gains, tax effects, impairments, restructuring, stock compensation, and accounting estimates can change EPS without the same change in recurring cash economics.
一次性收益、税务、减值、重组、股权激励与会计估计可能改变EPS,却不一定同等改变经常性现金经济。
Cyclicality周期性
Peak earnings can make a cyclical company look deceptively cheap, while trough earnings can make it look expensive.
盈利高峰会让周期公司看起来异常便宜,盈利低谷则可能让它看起来昂贵。
Capital structure资本结构
P/E is an equity multiple and does not directly standardize debt, cash, pension deficits, or leases across companies.
市盈率是权益倍数,不能直接标准化不同公司的债务、现金、养老金缺口或租赁。
Growth without value增长不等于价值
A high-growth company can still be overpriced, while a low-growth company can destroy value if returns fall below its cost of capital.
高增长公司仍可能定价过高,低增长公司若资本回报低于资本成本也可能破坏价值。
P/E ratio vs earnings yield and other multiples市盈率、盈利收益率与其他估值倍数
Earnings yield is the inverse of P/E: EPS divided by price, or earnings divided by market capitalization. A 20× positive P/E corresponds to a 5% earnings yield. The yield can be easier to compare with required returns, but it remains based on the same earnings definition and does not equal a cash distribution.
盈利收益率是市盈率的倒数,即EPS除以股价,或净利润除以市值。正的20倍市盈率对应5%盈利收益率。收益率形式更便于与必要回报比较,但仍依赖相同盈利口径,也不等于现金分配。
Use price-to-sales when earnings are temporarily negative but revenue is meaningful, price-to-book where balance-sheet capital is economically relevant, and EV/EBITDA or EV/EBIT when capital structures differ. Each substitutes a different question; none repairs poor data or eliminates valuation judgment.
当盈利暂时为负但收入有意义时可考虑市销率;账面资本具有经济意义时可考虑市净率;资本结构不同时可使用EV/EBITDA或EV/EBIT。每种倍数回答不同问题,不能修复劣质数据,也不能取代估值判断。
An auditable P/E workflow with QVeris and FMP使用QVeris与FMP建立可审计的市盈率流程
Lock the observation锁定观测口径
Record symbol, exchange, currency, price timestamp, fiscal calendar, and whether the price is adjusted.
记录代码、交易所、币种、价格时间、财务日历以及价格是否调整。
Retrieve and reconcile EPS获取并核对EPS
Match income attribution, basic or diluted shares, reporting period, restatements, and provider key metrics.
匹配利润归属、基本或稀释股份、报告期间、重述与提供方关键指标。
Calculate both equivalent forms计算两种等价形式
Compare price/EPS with market cap/net income and investigate material differences before ranking companies.
比较股价/EPS与市值/净利润,排名前先调查重大差异。
Preserve provenance保存来源链
Store the QVeris capability, FMP endpoint, parameters, retrieval time, fields, formulas, exclusions, and comparison universe.
保存QVeris能力、FMP接口、参数、获取时间、字段、公式、排除项与比较范围。
QVeris can help discover and call relevant FMP price, income-statement, share, ratio, and estimate capabilities. The analyst remains responsible for definitions, data validation, comparable selection, and the investment conclusion; neither QVeris nor FMP guarantees returns.
QVeris可帮助发现并调用FMP价格、利润表、股份、比率与预期数据能力。分析师仍须对定义、数据验证、可比公司选择与投资结论负责;QVeris与FMP均不保证收益。
Stock fundamental analysis framework股票基本面分析框架 · FMP financial statements through QVeris通过QVeris使用FMP财务报表 · QVeris documentationQVeris文档
Price to earnings ratio FAQ市盈率常见问题
What does the P/E ratio tell you?市盈率能说明什么?
It shows how much market value investors place on each unit of earnings under a stated EPS definition and period.
它表示在明确EPS定义与期间下,市场为每一单位盈利赋予多少价值。
How is the price to earnings ratio calculated?市盈率怎么计算?
Divide price per share by earnings per share, or market capitalization by earnings attributable to common shareholders, using consistent dates and definitions.
用每股价格除以每股收益,或用普通股市值除以归属于普通股股东的盈利,并保持日期与定义一致。
Is a high P/E ratio good or bad?高市盈率是好还是坏?
Neither by itself. It may reflect growth and quality or overpricing; compare the embedded expectations with evidence and risk.
单独看既不是好也不是坏。它可能反映增长与质量,也可能反映定价过高,应把隐含预期与证据及风险比较。
What is a good P/E ratio for a stock?股票市盈率多少合适?
There is no universal threshold. Use comparable companies and the firm’s history with consistent growth, risk, leverage, industry, and earnings periods.
不存在统一阈值。应在增长、风险、杠杆、行业与盈利期间一致的前提下比较同行和公司历史。
What does a negative P/E ratio mean?负市盈率是什么意思?
It means EPS is negative. The multiple is normally marked not meaningful because ordering negative P/E values produces misleading comparisons.
它表示EPS为负。通常应标记为无经济意义,因为对负市盈率排序会产生误导。
Why can two websites show different P/E ratios?为什么不同网站的市盈率不一样?
They may use different price timestamps, basic or diluted EPS, trailing or forward periods, adjustments, restatements, share classes, or data refresh times.
它们可能采用不同价格时间、基本或稀释EPS、滚动或预测期间、调整项、重述、股份类别或刷新时间。
References and methodology sources参考资料与方法来源
- Investor.gov — Price-earnings ratio
- Fidelity — What is price-to-earnings ratio?
- FMP — Financial data API documentation
Educational content only; not investment advice. P/E is one relative valuation measure and cannot establish fair value or predict returns by itself.本文仅供教育用途,不构成投资建议。市盈率只是相对估值指标,不能单独确定公允价值或预测收益。