
Growth and margin durability增长与利润率持续性
Separate volume, price, mix, acquisitions, and currency effects. Compare gross, operating, and net margins and explain changes rather than merely ranking them.
拆分销量、价格、产品组合、并购与汇率影响;比较毛利率、营业利润率和净利率,并解释变化原因。
Stock fundamental analysis evaluates the business behind a ticker—its economics, financial statements, cash generation, valuation, and risks—before forming a documented thesis.
股票基本面分析关注股票代码背后的企业:商业模式、财务报表、现金创造能力、估值与风险,并在证据基础上形成可复核的研究结论。
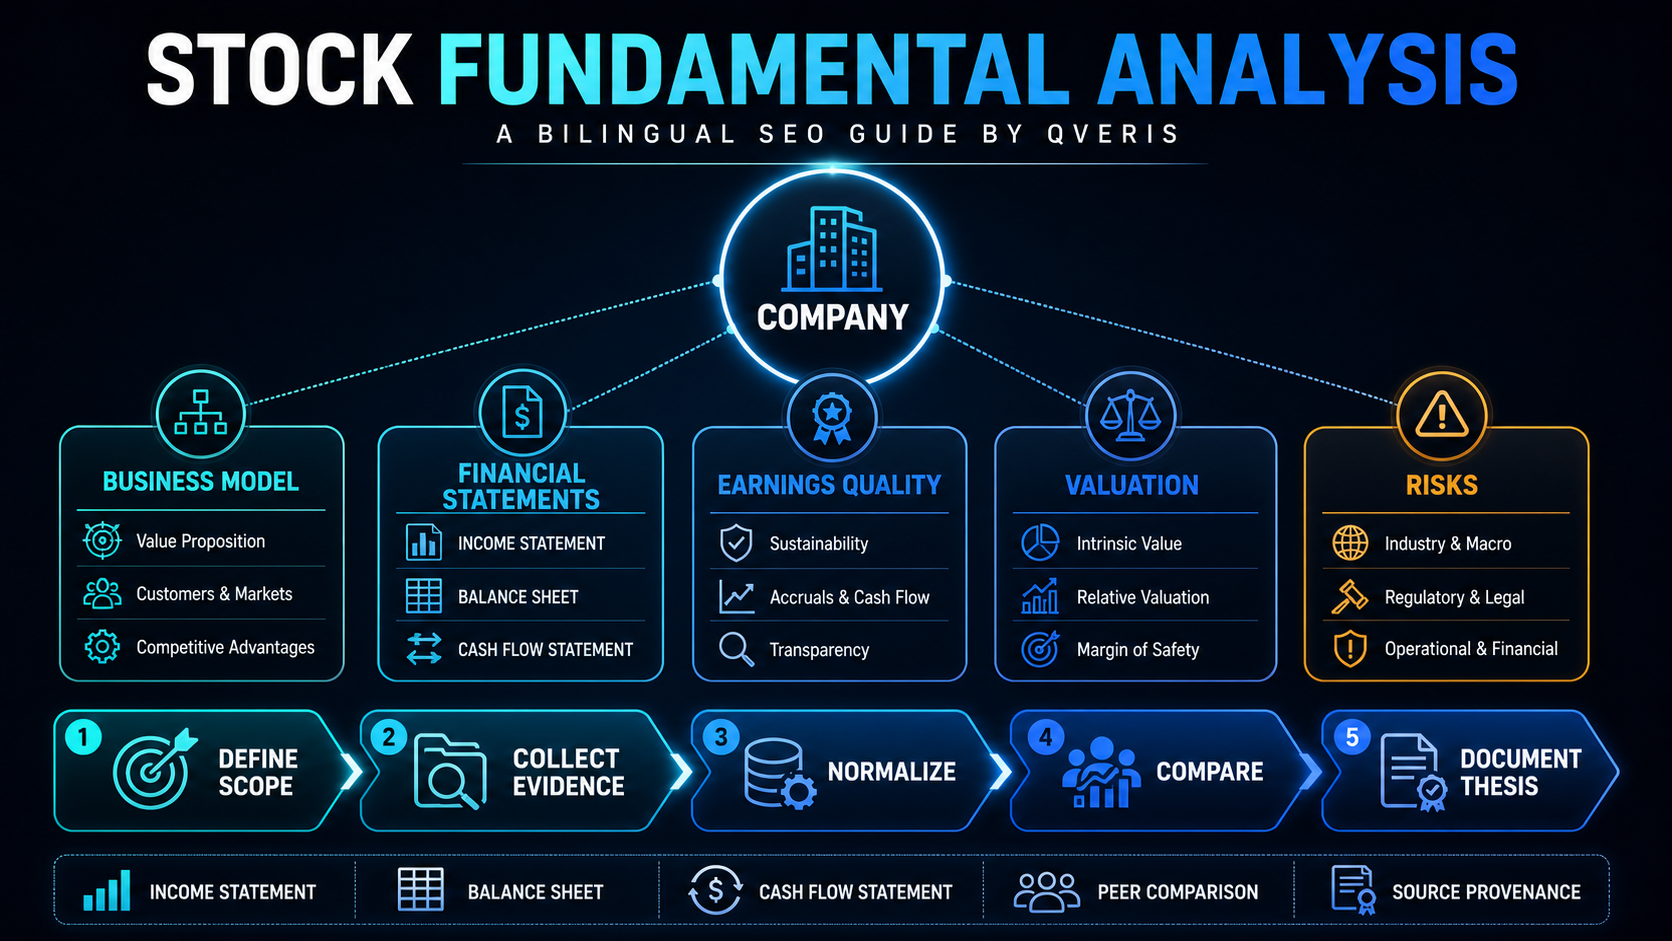
The main search intent is practical and informational: readers want to know what to examine, which financial statements and ratios matter, how to compare a company with peers, and how to avoid turning one attractive metric into a buy signal. A complete review connects five evidence groups.
用户真正想解决的不是背诵指标,而是知道应该看什么、三大财务报表如何串联、哪些比率适用、怎样比较同行,以及如何避免把单一好看的数字误当成买入信号。完整分析应连接五组证据。
Identify customers, products, revenue drivers, unit economics, market structure, competitive advantages, and the conditions that could weaken them.
识别客户、产品、收入驱动、单位经济、市场结构、竞争优势及其可能失效的条件。
Trace revenue, margins, returns, working capital, leverage, and cash flow over several comparable periods.
在多个可比期间追踪营收、利润率、资本回报、营运资金、杠杆与现金流。
Reconcile accounting profit with operating cash flow and inspect accruals, stock compensation, capitalized costs, and one-time items.
把会计利润与经营现金流核对,并检查应计项目、股权激励、资本化成本和一次性项目。
Compare price with normalized earnings, cash flow, assets, growth, and risk using more than one method.
用不止一种方法,把价格与标准化盈利、现金流、资产、增长和风险联系起来。
State what would invalidate the thesis: demand loss, margin compression, refinancing pressure, dilution, regulation, or governance failures.
明确哪些事实会推翻研究假设,例如需求流失、利润率收缩、再融资压力、稀释、监管或治理问题。
The income statement shows performance over a period, the balance sheet shows resources and obligations at a date, and the cash flow statement explains how cash changed. Their links matter more than any statement alone.
利润表反映一段期间的经营结果,资产负债表反映某个时点的资源与义务,现金流量表解释现金为何变化。报表之间的勾稽关系比单独查看任何一张表更重要。
Separate volume, price, mix, acquisitions, and currency effects. Compare gross, operating, and net margins and explain changes rather than merely ranking them.
拆分销量、价格、产品组合、并购与汇率影响;比较毛利率、营业利润率和净利率,并解释变化原因。
Review liquidity, debt maturity, lease obligations, goodwill, inventory, receivables, and the capital required to sustain growth.
检查流动性、债务到期、租赁义务、商誉、存货、应收账款,以及维持增长所需资本。
Reconcile net income to operating cash flow, distinguish maintenance from growth investment, and examine financing dependence.
把净利润与经营现金流核对,区分维持性投资与增长性投资,并观察企业对融资的依赖程度。
There is no universal “best” metric. Choose ratios that match the business model and compare them across time, peers, and accounting definitions.
不存在适用于所有公司的“最佳指标”。应根据商业模式选择指标,并统一期间、同行范围与会计定义。
Assume a fictional company reports 12% revenue growth, an operating margin rising from 14% to 16%, net debt falling, and free cash flow below net income. The first three facts look constructive, but the cash gap requires investigation. Was working capital absorbed by temporary inventory, were receivables stretched, or were costs capitalized? The example shows why a stock fundamental analysis checklist should create questions, not automatic scores.
假设一家虚构公司营收增长12%,营业利润率从14%升至16%,净债务下降,但自由现金流低于净利润。前三项看似积极,现金差距却需要追查:是临时备货占用营运资金、应收账款周期延长,还是部分成本被资本化?这个例子说明,股票基本面分析清单应产生可验证的问题,而不是自动给出分数。
A good business can be a poor investment at an unsupported price, while a low multiple can reflect real deterioration. Use relative valuation to understand market context and an intrinsic-value model to make assumptions explicit. Test revenue, margin, reinvestment, discount-rate, and terminal assumptions as ranges rather than one precise target.
好公司在缺乏支撑的价格下也可能不是好投资,低估值倍数也可能反映真实恶化。相对估值用于理解市场背景,内在价值模型用于把假设写清楚。营收、利润率、再投资、折现率和终值都应采用区间与情景,而不是伪精确的单点目标价。
Record ticker, exchange, share class, currency, fiscal calendar, valuation date, and the question being tested.
记录股票代码、交易所、股份类别、币种、财年、估值日期和待验证问题。
Retrieve filings, statements, notes, company disclosures, prices, estimates, and relevant industry evidence.
获取监管文件、报表及附注、公司披露、股价、预期和相关行业证据。
Align periods, currencies, split adjustments, GAAP versus adjusted metrics, and restatements.
统一期间、币种、拆股调整、GAAP与调整后指标以及重述数据。
Document drivers, valuation, risks, missing evidence, and the facts that would change the conclusion.
记录驱动因素、估值、风险、缺失证据,以及会改变结论的事实。
QVeris can help discover and call relevant FMP capabilities for company profiles, financial statements, key metrics, prices, and analyst estimates. A robust workflow should retain endpoint names, parameters, timestamps, units, returned fields, and calculation logic. QVeris orchestrates evidence access; it does not turn uncertain inputs into guaranteed outcomes.
QVeris可以帮助发现并调用FMP的公司资料、财务报表、关键指标、价格和分析师预期能力。可靠流程应保留接口名称、参数、时间戳、单位、返回字段和计算逻辑。QVeris负责证据访问与编排,不会把不确定输入变成确定收益。
Explore FMP financial statements through QVeris了解通过QVeris使用FMP财务报表 · FMP API guideFMP API指南 · QVeris documentationQVeris文档
A single period can reflect cycles, acquisitions, or unusual items.
单一期间可能受到周期、并购或异常项目影响。
Definitions, contingencies, segments, and accounting changes often live outside the headline statements.
定义、或有事项、分部与会计变更常藏在主表之外。
Different economics, leverage, geography, and accounting can make ratios misleading.
商业模式、杠杆、地区与会计差异会使比率失真。
Consensus estimates are versioned assumptions and can change quickly.
一致预期是有版本的不确定假设,可能快速变化。
It evaluates a company’s business, financial statements, cash generation, valuation, competitive position, and risks to form an evidence-based view.
它通过企业商业模式、财务报表、现金创造、估值、竞争地位与风险形成基于证据的判断。
Start with the business model, connect the three statements, review trends and peers, test valuation assumptions, and document risks and unknowns.
从商业模式开始,串联三大报表,比较趋势与同行,测试估值假设,并记录风险与未知项。
No single ratio is best. Growth, margins, returns, leverage, coverage, cash conversion, and valuation must fit the industry and question.
没有单一最佳比率;增长、利润率、回报、杠杆、偿付、现金转化与估值需匹配行业和研究问题。
Use enough comparable periods to cover normal operations and, where possible, a business cycle. The exact span depends on the company and data quality.
应覆盖正常经营状态,并在可能时覆盖一个商业周期;具体年限取决于公司历史与数据质量。
It is a research method, not certainty. Portfolio fit, liquidity, time horizon, risk tolerance, price, and new information still matter.
它是研究方法而非确定答案;组合适配、流动性、期限、风险承受力、价格和新信息同样重要。
QVeris can orchestrate discovery and calls to FMP data capabilities and preserve provenance. Human review remains necessary for accounting judgments, assumptions, and conclusions.
QVeris可编排FMP数据能力的发现与调用并保留来源;会计判断、假设和结论仍需人工复核。
Educational content only. Fundamental analysis cannot eliminate uncertainty or guarantee performance.本文仅供教育用途。基本面分析不能消除不确定性,也不能保证投资表现。