The short answer
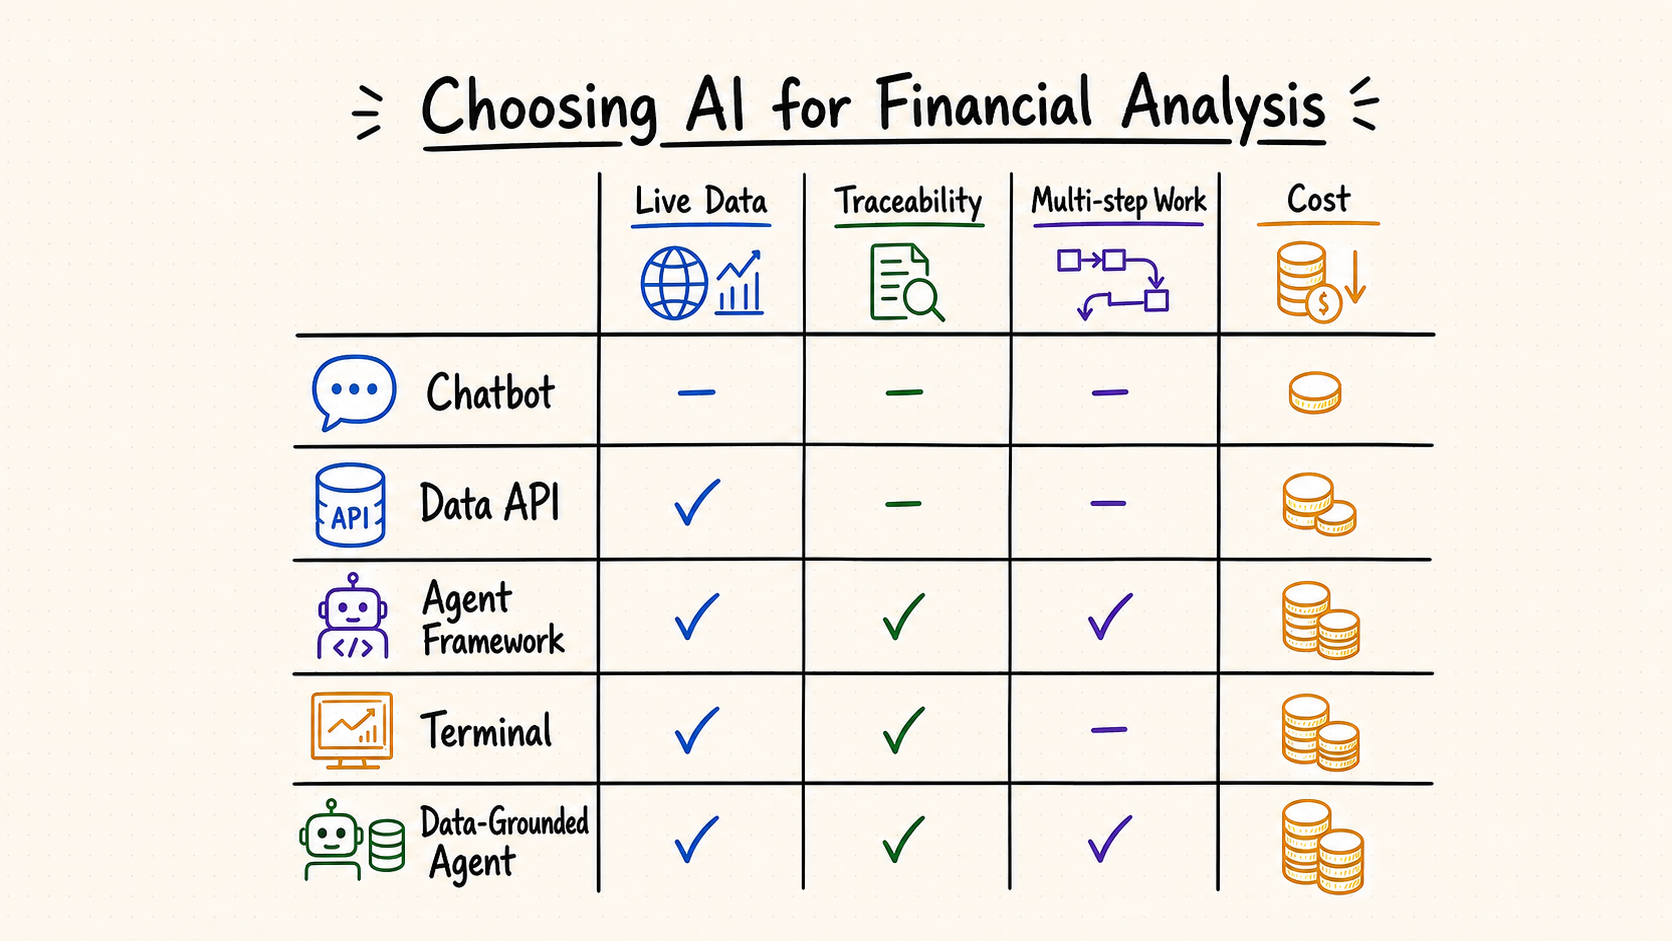
If you only read one thing: general chatbots are writing tools that happen to know finance; data APIs are inputs, not answers; agent runtimes with licensed data attached are the only category that produces analysis you can hand to someone else without re-checking every figure.
| Category | Best for | Data | Citations | Cost |
|---|---|---|---|---|
| General chatbots ChatGPT, Claude, Gemini | Explaining concepts, drafting memos | Web search, no licensed market feed | Inconsistent — links, not data lineage | $20–30 / month |
| Raw data APIs FinancialDatasets.ai, Polygon | Building your own pipeline | Strong, structured, per-endpoint | You build it | Per request |
| Agent frameworks Composio, LangChain | Wiring many tools together | Whatever you connect | You build it | Platform + underlying data |
| Terminals Bloomberg, FactSet, CapIQ | Institutional coverage & compliance | Deepest available | Yes, but not agent-readable | $25k+ / seat / year |
| Agent runtimes with data Qveris | Recurring research with sourced numbers | Prices, filings, fundamentals, news in one schema | Every figure traced to endpoint & period | Free tier, $79 / seat |
How we evaluated them
Benchmarks that ask a model to define WACC tell you nothing about whether it can pull a 10-Q. We ran each category through a fixed set of research tasks drawn from real analyst workflows and scored four things on every answer.
- Factual accuracy — every numeric claim checked against the primary filing or the exchange print. One wrong figure fails the answer, regardless of how good the prose is.
- Traceability — can a second person reproduce the figure from what the tool returned, without asking the first person where it came from?
- Completion without babysitting — how many corrective prompts before the answer was usable. Zero is the target; three or more means the tool is doing less work than the human.
- Time to answer — wall-clock from question to a result you could paste into a memo, including verification time.
A tool that answers in eight seconds but requires nine minutes of fact-checking is slower than one that takes ninety seconds and cites its sources. Unsourced speed is a cost transfer, not a saving.
Five criteria that actually predict whether an AI is useful here
1. Does it have licensed data, or is it guessing?
The single biggest failure mode in AI financial analysis is a plausible number with no source. A model without a market data connection will interpolate a P/E from stale training data, and it will do so confidently, in the correct format, with a reasonable-looking decimal. Before anything else, check whether the tool reads a live feed at query time.
Ask the vendor: which datasets are licensed, who the upstream provider is, what the data latency is, and what happens when the model is asked something outside coverage — does it refuse, or does it improvise?
2. Can it cite the exact endpoint and period?
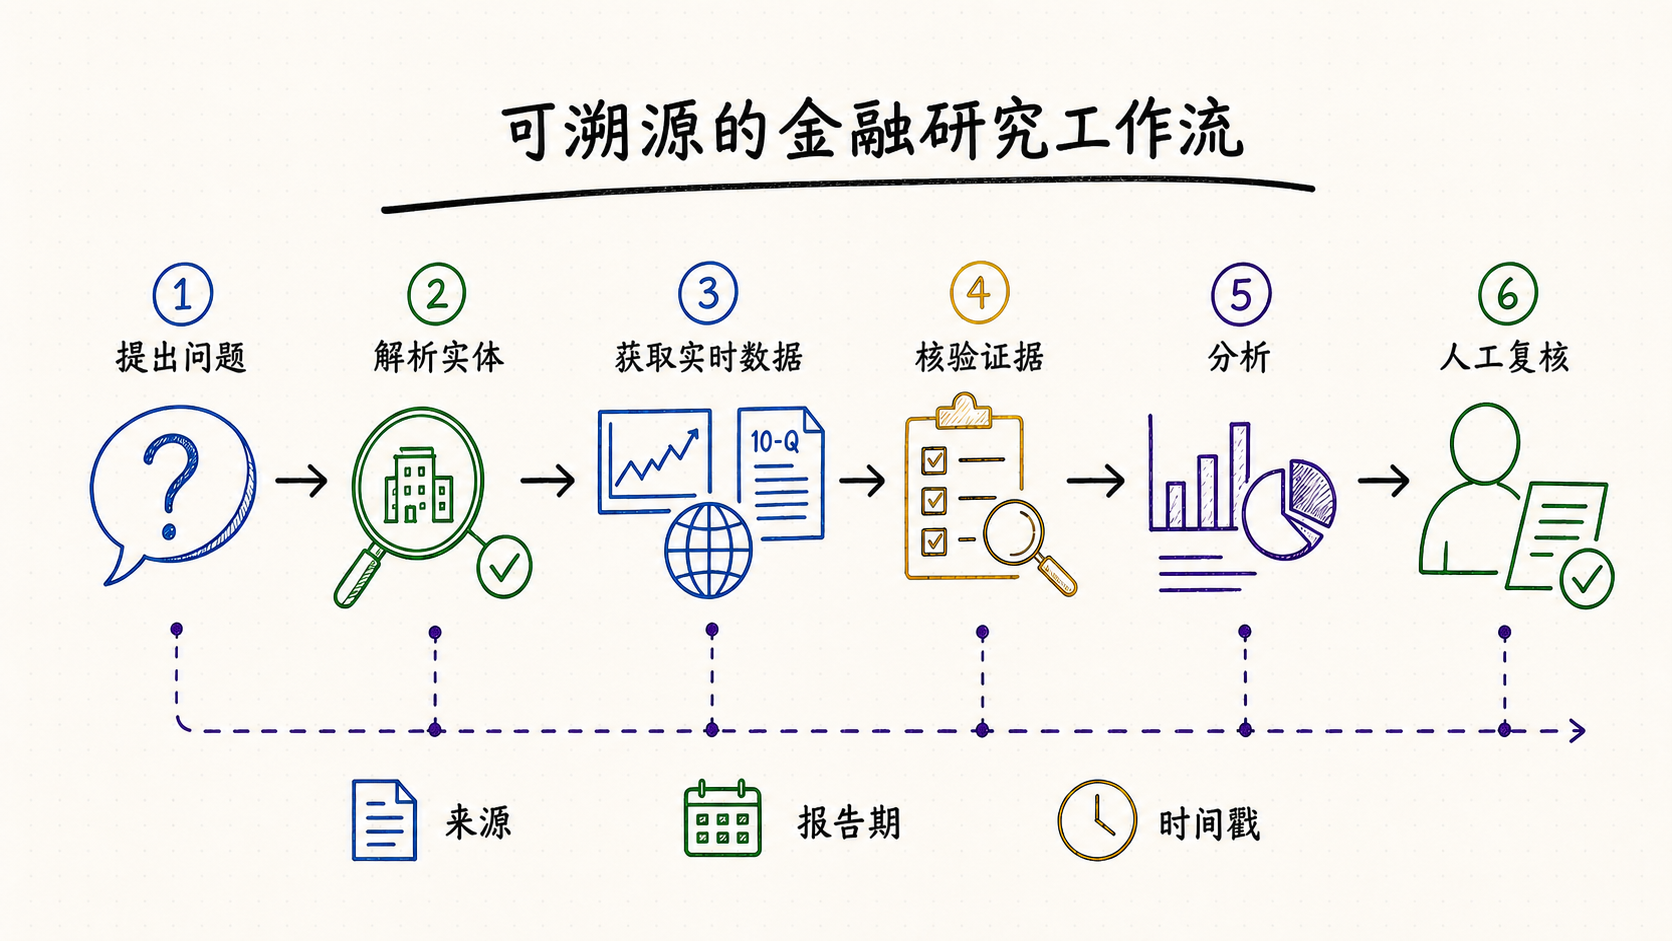
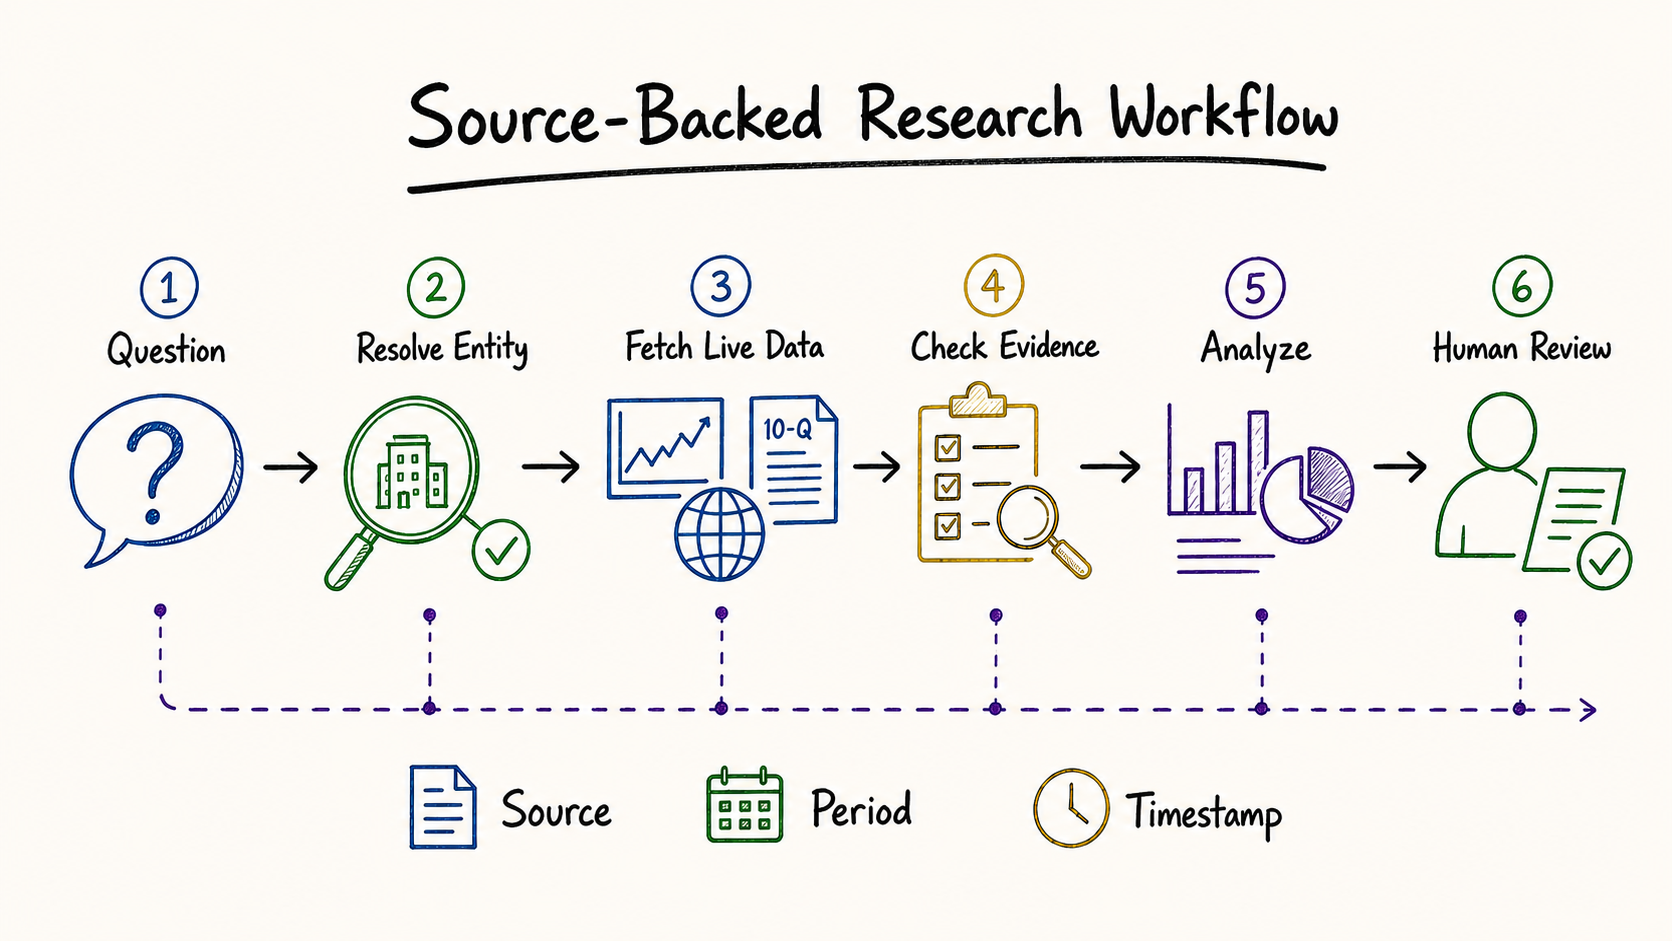
A link to a filing is not a citation. You want the statement, the fiscal period, the unit, and the retrieval timestamp, so a reviewer can reproduce the figure without repeating the search. This is the line that separates a research tool from a writing assistant, and it is the line that compliance cares about.
Ask the vendor: show me one answer where a number came from a restated filing. Which version did you use, and does the citation say so?
3. Does it handle multi-step questions?
“Which of these 40 semis expanded gross margin for three straight quarters while insider buying rose?” is four data pulls and a join. Chat interfaces answer it narratively and quietly drop the names they could not check; agent runtimes answer it by executing tools and returning a table where every row is accounted for. The difference only shows up on questions with more than one hop, which is why single-question demos are misleading.
Ask the vendor: when coverage is incomplete, does the output say “37 of 40 evaluated, 3 missing data”, or does it silently return 37?
4. What is the cost per completed task, not per token?
A cheap model that needs six corrective prompts costs more than an expensive one that gets it right once — and most of the cost is your time, not the API bill. Price the workflow end to end: the model calls, the data calls behind them, and the analyst minutes spent verifying.
5. Can you audit and re-run it?
Research you cannot reproduce next quarter is not research, it is an anecdote. Look for saved runs, versioned prompts, stable tool schemas, and point-in-time data so that re-running a March screen in June gives you March's answer when you ask for it.
Category deep dives
General chatbots
Strength: unmatched at explaining, structuring and drafting. Ask one to lay out a DCF, critique an investment thesis, or turn bullet points into an IC memo and it performs at the level of a strong associate.
Weakness: no licensed feed. Web search retrieves whatever page ranks, which for financial data is often a scraper site with stale or wrong numbers. Citations point at pages, not at line items.
Verdict: keep it, use it for language and reasoning, and never let a number leave it unverified.
Raw data APIs
Strength: the numbers are correct, structured and cheap at volume. If you are building a product, this is the foundation everything else sits on.
Weakness: an API is an input, not an answer. You own identifier mapping, retries, caching, tool schemas and the citation layer — typically weeks of engineering before the first useful agent response.
Verdict: right choice for engineering teams; wrong choice for an analyst who needs an answer this afternoon. What to look for in one →
Agent frameworks
Strength: flexible orchestration, hundreds of integrations, no lock-in to one data vendor.
Weakness: generic tool layers are not tuned for finance. The model has no idea that a fiscal year ending 31 January is not a calendar year, that TTM and LTM are the same thing, or that a restated figure should not be compared with an as-reported one. Those semantics are yours to encode.
Verdict: excellent glue, not a finance product on its own.
Terminals
Strength: the deepest and best-governed data available, plus the compliance posture large institutions require. Nothing else covers private credit, munis, loan-level detail and global small caps to the same depth.
Weakness: the data is licensed for humans looking at screens. Programmatic and agent access is restricted, expensive, or both, so the AI layer usually cannot reach the data you are already paying for.
Verdict: keep it if you need it; add an agent layer beside it rather than expecting it to become one.
Agent runtimes with data attached
The newest category, and the one built specifically for the failure modes above: licensed datasets behind a single schema, exposed to the model as typed tools, with every figure carrying its endpoint, fiscal period and retrieval time. Because the runtime owns both the data and the tool layer, it can enforce things a generic framework cannot — refusing to answer outside coverage, flagging restatements, and returning a complete accounting of what it could and could not evaluate.
Trade-off: coverage is narrower than a terminal, and you are trusting one vendor's normalisation. Evaluate it on your own tickers before committing.
Head to head on six real tasks
Scored as: Good = usable without correction, Partial = right shape, needs verification, Poor = wrong or unverifiable.
| Task | Chatbot | Data API | Terminal | Agent runtime |
|---|---|---|---|---|
| Pull last 8 quarters of revenue and gross margin for one company | Partial | Good | Good | Good |
| Screen 500 tickers on three fundamental conditions | Poor | Good (you code it) | Good | Good |
| Summarise risk-factor changes between two 10-Ks | Partial | N/A | Partial | Good |
| Explain why a stock moved 9% yesterday, with sources | Partial | N/A | Good | Good |
| Build a comps table for eight peers, same accounting basis | Poor | Good (you code it) | Good | Good |
| Draft the investment memo around the numbers | Good | N/A | Poor | Good |
The pattern is consistent: chatbots win on language, terminals and APIs win on data, and only the runtime category is competitive across the whole row — which matters because real workflows are a whole row, not one cell.
Which to pick, by role
Equity analyst / PM
An agent runtime with citations, alongside whatever terminal you already have. The win is the two hours a day currently spent assembling data rather than judging it.
Fintech founder / engineer
A data API plus your own agent layer if the data pipeline is your product; a runtime with tool access if it is a feature and you would rather ship this quarter.
Corporate finance / IR / corp dev
Runtime for peer benchmarking and filings comparison, chatbot for drafting. Terminals are usually overkill at this volume.
Serious retail investor
A chatbot for learning plus a free-tier runtime for the numbers. Never trust an unsourced figure from a chatbot in a position sizing decision.
Where AI still fails — and what to do about it
- Confident wrong numbers. The defining risk. Mitigation: only accept figures that arrive with a source, and reject the answer format that does not have one.
- Restatements and as-reported vs adjusted. Models happily compare a restated 2024 figure with an as-reported 2023 one. Mitigation: point-in-time data, and citations that name the filing version.
- Fiscal calendars. Companies with non-calendar year ends break naive quarter-over-quarter logic. Mitigation: ask for fiscal period labels in the output, not dates.
- Survivorship in screens. A universe built from today's index members deletes every company that failed. Mitigation: historical constituents for anything backward-looking.
- Silent partial coverage. The most dangerous failure, because the output looks complete. Mitigation: demand an evaluated/missing count on every screen.
- Judgement. No model knows that management has missed guidance three times and the new CFO came from a company with the same problem. Mitigation: this is your job, and it always will be.
The real cost math
A worked example for one analyst doing five company deep dives and two screens a week.
| Approach | Software / data | Analyst hours per week | Loaded cost per week |
|---|---|---|---|
| Manual + chatbot for drafting | ~$25 / mo | ~14 hrs gathering data | ~$1,400 |
| Self-built agent on a data API | ~$300 / mo + build | ~5 hrs, plus engineering upkeep | ~$570 + eng time |
| Agent runtime with data | ~$79 / seat / mo | ~4 hrs, mostly verification | ~$420 |
| Terminal seat | ~$2,100 / mo | ~8 hrs | ~$1,300 |
Assumes a $100/hr loaded analyst rate. The point is not the precise figures, which vary by firm — it is that software price is the smallest term in every row. Optimising a $30 subscription while spending fourteen hours a week on data assembly is the wrong optimisation.
A 30-day rollout plan
- Days 1–5: pick ten questions you actually asked last month. Write down the correct answers from your own records. This is your benchmark, and it is worth more than any vendor demo.
- Days 6–12: run all ten through two or three candidate tools on free tiers. Score accuracy, traceability and corrective prompts. Do not score prose quality.
- Days 13–20: take the leader and run one real workflow end to end — a full deep dive that ships to a real reader. Track verification time honestly.
- Days 21–30: write the house rule: which outputs may be used unverified, which need a second pair of eyes, and how sources get attached to anything that leaves the team. Then roll out.
Glossary
| Term | What it means here |
|---|---|
| Point-in-time | Data as it was known on a given date, before restatements. Essential for anything backward-looking. |
| Data lineage | The full path from a displayed number to the source record, period and retrieval time. |
| Tool call / function call | The model invoking a defined API endpoint with typed arguments instead of recalling from memory. |
| Fan-out | One user question expanding into many parallel data requests. |
| Grounding | Constraining a model's answer to retrieved source data rather than its training weights. |
| As-reported vs adjusted | Figures exactly as filed, versus normalised by a data vendor for comparability. Never mix them in one series. |
Where Qveris fits
Qveris is the agent-runtime option: prices, filings, fundamentals and news behind one schema, exposed to the model as typed tools, with every figure traced back to the endpoint and fiscal period it came from. Screens return an evaluated/missing count, restatements are versioned, and every run is saved so you can re-run it next quarter and get a comparable answer. Free tier for evaluation, paid plans from $79 per seat.