
Why Do Top Global Models Still Score Below 58% on Financial Analysis?
Why Do Top Global Models Still Score Below 58% on Financial Analysis?
Subtitle: From Vals Finance Agent v2 to retesting two public questions: the weakness of financial agents may not be “analysis,” but “object identification.”
In July, Vals AI updated the Finance Agent v2 benchmark.
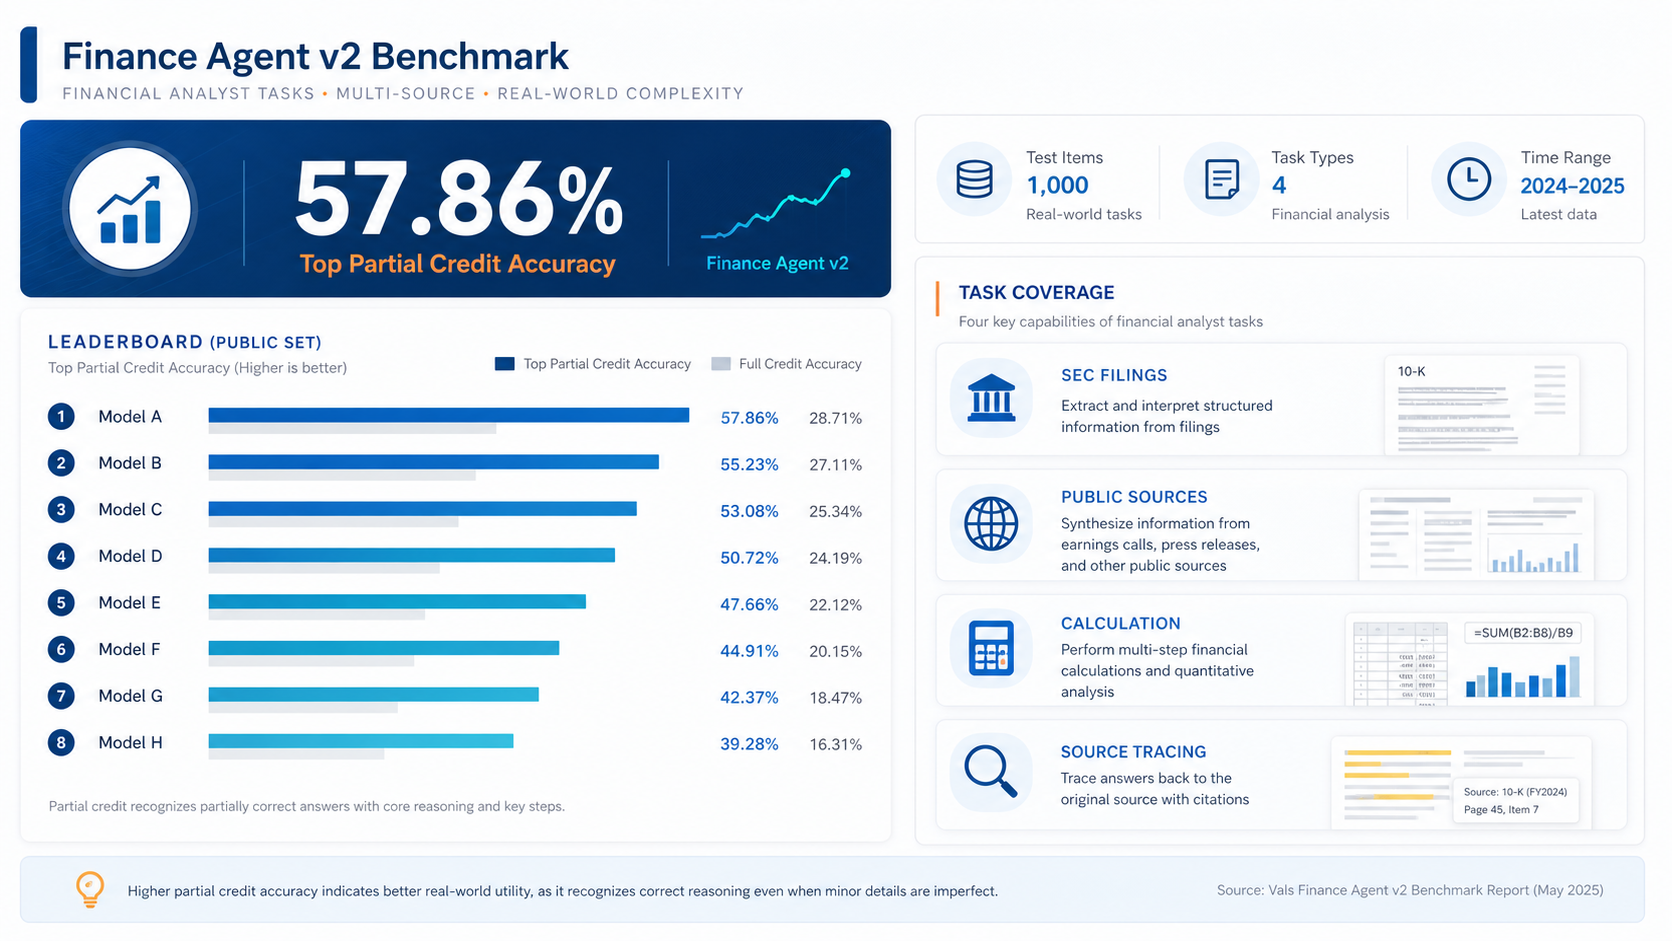
This benchmark is worth reading carefully. It is not a financial knowledge Q&A, nor is it asking the model to explain "what is the price-earnings ratio" or "why bond prices move inversely with interest rates". It is closer to the daily work of a junior financial analyst: checking SEC filings, reading company announcements, extracting key figures, doing cross-source calculations, and finally giving a traceable answer.
This type of task is very different from ordinary chat.
For ordinary Q&A, as long as the language is smooth and the answers are generally relevant, users may think it is "not bad". But that's not the case with financial analysis. If a number is wrong, a filing is wrong, or a definition is mixed up, the final conclusion may be completely unusable.
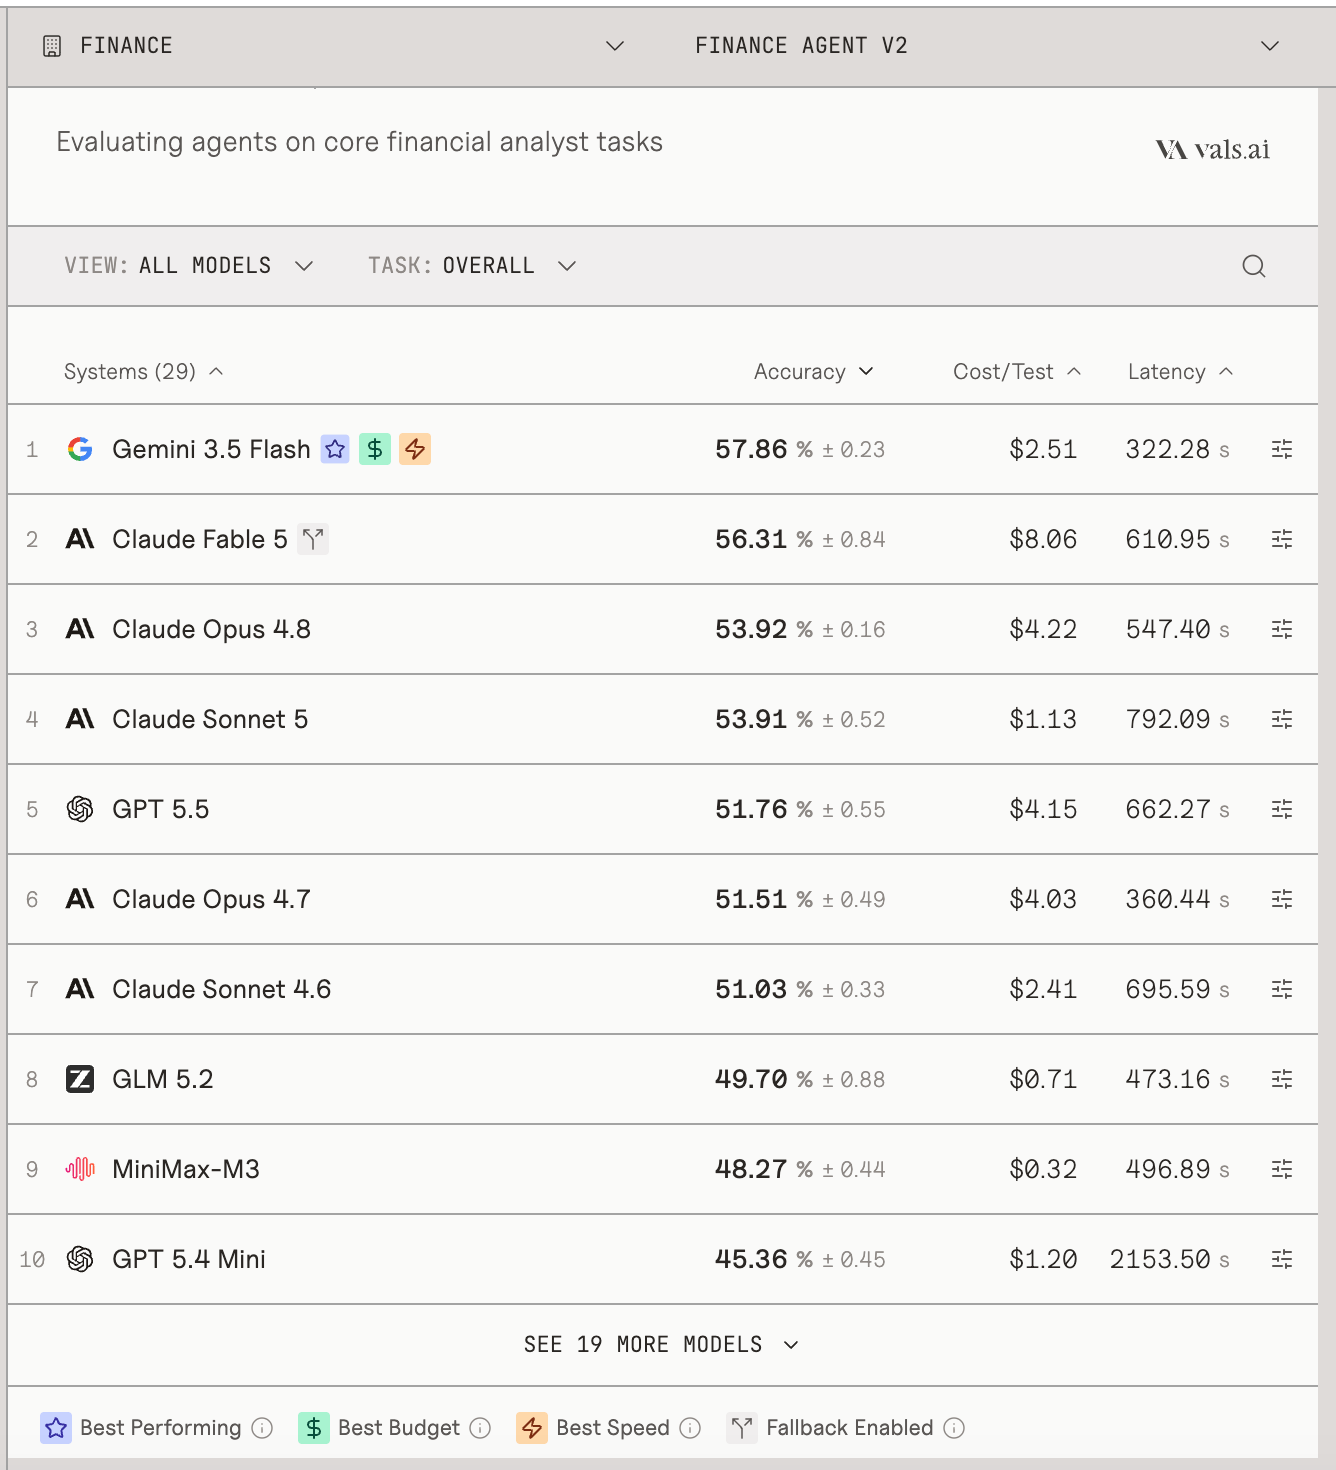
Figure 1: Vals Finance Agent v2 official leaderboard screenshot
The official leaderboard of Vals Finance Agent v2 shows that the best performing model still does not exceed 57.86% accuracy. If the more stringent all-pass standard is adopted and all key inspection items are required to pass, the model performance will further decline.
This is inconsistent with many people’s intuition about financial AI.
Today’s big models are already very good at writing financial content. Give it a company and it can organize quotes, valuations, news, financial summaries and investment logic; give it a financial report and it can summarize revenue, profits, guidance and risk factors. Much of the output already looks like a qualified investment research summary.
But Vals’s comments remind us: The difficulty of financial tasks is not “whether the writing is similar”, but “whether the checking is accurate, whether the calculation is correct, and whether the definition can be aligned.”
This is why the financial agent’s ability cannot be based solely on the final answer. We should look more closely at what it went through during the process:
- Is it checking the right company?
- Did you get the correct filing?
- Are the correct fields extracted?
- Do the two companies disclose the same indicator definition?
- Can the calculation process be replayed?
- Can the numbers in the final answer be returned to the original source?
If any step in these steps is wrong, the better you can write the model, the more hidden the risk will be.
The design of Vals v2 is also very representative.
It splits the task into three parts: Public, Private Validation, and Test. There are only 27 public questions, and the test set actually used for the ranking is not public. This design itself shows that financial evaluation has begun to enter a more serious stage: it is not just about giving a batch of questions to the model, but to prevent data pollution, retain invisible test sets, and use more fine-grained rubrics to judge the quality of the answers.
This also means that we cannot simply reproduce the official leaderboard. But you can use its public questions to do some diagnostic tests: instead of seeking a total score, you can observe where the financial agent will fail.
I chose two of the public questions and conducted a small comparative experiment.
Figure 2: Finance Agent v2 evaluation task structure diagram
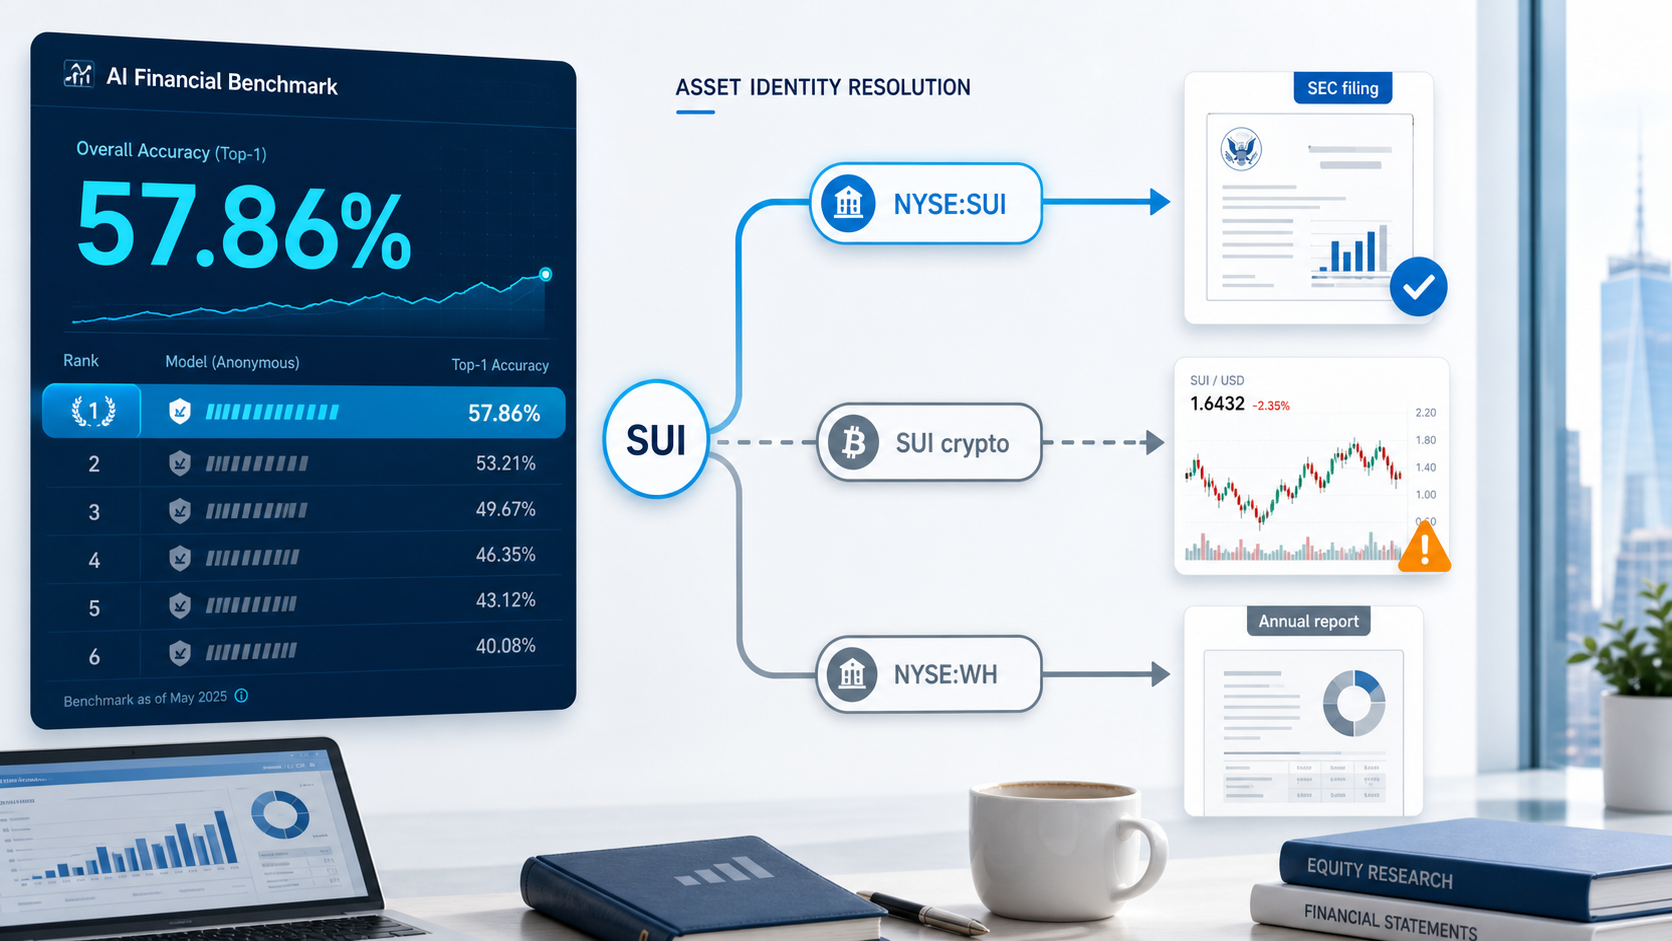
First example: Is SUI a company or a crypto asset?
There is a question in Vals public set asking:
NYSE:SUI made an announcement about a CEO transition in July 2025...
The question requires finding out who the new CEO of Sun Communities will be in the July 2025 CEO transition announcement and when he will take office.
If the identity boundaries are preserved intact, the retrieval path is clear:
NYSE:SUI Sun Communities CEO transition July 2025 8-K
This query will lead to Sun Communities' Form 8-K and corporate announcements. The answer is clear: the new CEO is Charles D. Young and the effective date is October 1, 2025.
But if you check SUI as a bare code, for example:
SUI historical data July 2025
The search results easily lead to another world: Sui crypto.
Also called SUI, it also has price history and financial data pages. For an Agent without asset identity constraints, this path is not absurd. The problem is, it answers all the wrong questions.
This is not a failure of reasoning, but a failure of identification.
In financial tasks, ticker is not a complete identity. SUI is the Sun Communities in the title only if it is bound to NYSE, company entity, and security type. Taken out of this context, it can point to a completely different asset.
Second example: WH is not a hotel keyword
Another open question asks for comparison:
The performance of NASDAQ:MAR and NYSE:WH on the FY2025 loyalty program, including the proportion of room nights/check-ins contributed by members, and the funding mechanism of the loyalty program.
If fuzzy search:
WH loyalty funding mechanisms FY2025
The results will diverge significantly. WH is too short, hotels, subsidies, general loyalty pages, and marketing pages may be mixed in.
But if you retain your full financial identity:
NYSE:WH Wyndham Hotels 2025 annual report Wyndham Rewards check-ins funded by contributions
The search path is much more stable. WH is tied to Wyndham Hotels & Resorts, and data sources converge from pan-web pages to annual reports and SEC filings.
There's a second layer of difficulty with this question: Marriott and Wyndham don't disclose the same metric.
Marriott discloses the ratio of member stays to room nights.
What Wyndham discloses is the percentage of check-ins held by Wyndham Rewards members.
One is room nights and the other is check-ins. Both are related to the loyalty program, but they cannot be compared roughly on the same level.
Therefore, this question does not test “whether you can search”. It's actually measuring four things:
- Does the model recognize that
MARis a Marriott andWHis a Wyndham; - Whether market boundaries such as
NASDAQ/NYSEare retained; - Whether you have entered the correct filing page, not the marketing page;
- Do you realize that room nights and check-ins are not the same disclosure.
The failure here is still not "the model cannot write conclusions".
But the financial objects, data sources and indicator definitions were not locked first.
Figure 3: Bare code vs with market identity: two different data paths
Why are this kind of errors common in financial agents?
Because the identification system of financial data is not naturally unified.
A shortcode may have the same name across markets.
The same company may have multiple securities.
The same asset may include stocks, bonds, ETFs, ADRs, and derivatives.
The same indicator may have different disclosure standards in different companies, different categories, and different documents.
The reason why the stock scene makes AI seem more stable is because it is the most mature default path in financial AI. Stocks have relatively standard tickers, quotes, financial reports, valuation indicators and rich public corpus. The tool chains and training corpus of most financial agents are also most likely to revolve around stocks.
But once you get into funds, bonds, ETFs, REITs, or cross-market assets, this default path isn’t enough.
A fund is not a company.
A bond is not a stock.
ETFs are not ordinary individual stocks.
Although REITs are listed and traded, their operating indicators, dividend logic, and asset attributes are different from ordinary companies.
If the system compresses all financial objects into a naked ticker and then submits it to model analysis, many errors will have been buried in the first step.
Small fixes we made
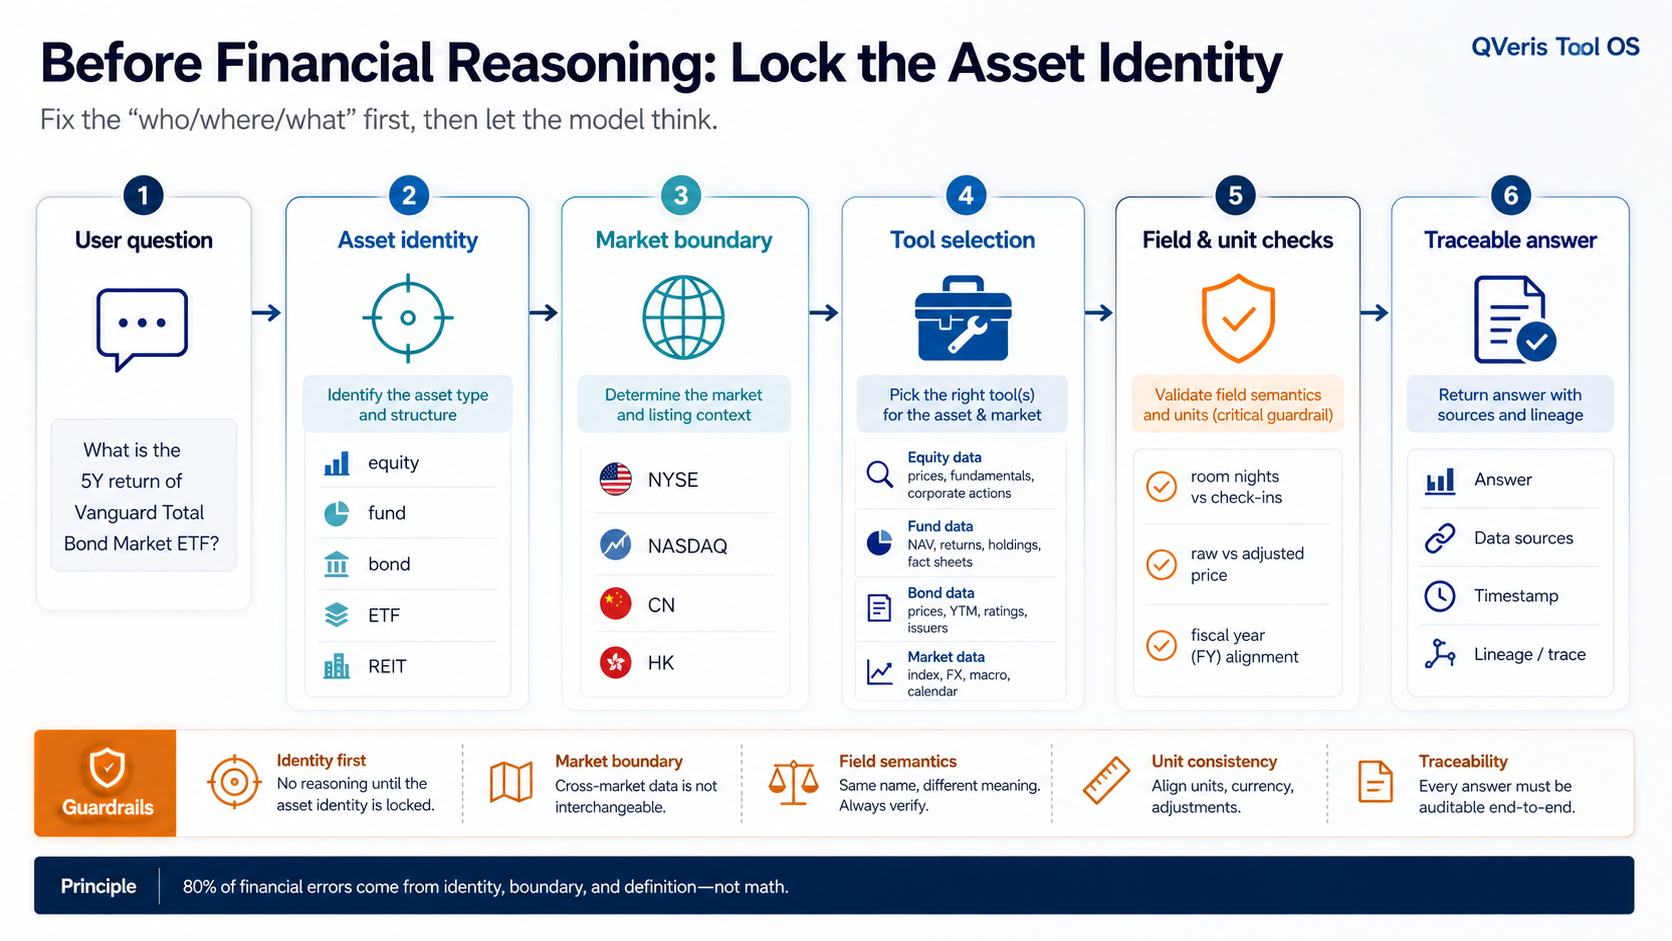
Following these two public questions, we have made a small but key repair direction in QVeris: when processing financial code, we no longer treat it as a bare ticker, but first retain the market and asset type boundaries, and then enter tool selection, parameter derivation and data retrieval.
To put it simply, ask clearly first:
- Which market code is this?
- Is it a stock, fund, bond, ETF, or another asset?
- Can this code deduce the market from context?
- If it can be deduced, are the mapping rules clear?
- If the derivation cannot be made, the system should stop instead of guessing.
In our small comparison test, under the fuzzy path,
SUIis easily taken to crypto, andWHis easily taken to the pan-hotel web page. After retaining the identity of the market and assets, both questions can lead to the correct company, correct filing and correct disclosure standards.
This is not a complete benchmark, nor can it be packaged as an official score improvement.
But it illustrates a reusable direction: the reliability of a financial agent not only depends on the model itself, but also depends on whether there is a layer of stable asset identification and definition constraints before it calls the tool.
This is also a layer of capabilities that QVeris has continued to add to its bottom layer recently.
We don’t want the Agent to just “find a result that seems relevant.” We hope that it first knows what it is looking for: is it the company NYSE:SUI, or Sui crypto; is it the annual report of NYSE:WH, or is it a pan-hotel webpage; is it a stock, fund, bond, or another asset with the same name.
The model is responsible for reasoning, but in order for the financial agent to truly enter the workflow, it must first get these things right: "what to check, where to check, how to interpret it, and whether it can be used."
Figure 4: Financial Agent’s asset identification link
Vals list really reminds us
The value of Vals Finance Agent v2 does not just tell us where a certain model ranks.
It is more like reminding the financial industry that the evaluation criteria for financial agents cannot stop at "whether the answer is decent."
What really depends is whether it can complete a verifiable working link.
From the question to the data source, from the data source to the field, from the field to the calculation, from the calculation to the conclusion, every step must be able to be checked. Especially in a high-density field like finance, the availability of answers often depends on the first few steps.
If the object is wrong at the beginning, no matter how powerful the model, no matter how beautiful the report, no matter how complex the reasoning is, they will all be optimized on the wrong path.
Therefore, the world's top model reaches less than 58% in Finance Agent v2. This is not just a matter of model capability.
What it exposes is a common shortcoming of systems such as financial agents: financial tasks are not ordinary text tasks. It requires that in addition to the model, there is a stable set of tools, data, identifiers, definitions, and verification infrastructure.
This is also a basic standard by which we now judge financial AI:
Don’t first look to see if it can write an answer that sounds like an expert.
First see if it can find the right partner.
References
- Vals AI Finance Agent v2: https://www.vals.ai/benchmarks/fabv2
- Vals Finance Agent v2 public questions: https://raw.githubusercontent.com/vals-ai/finance-agent-v2/main/data/public.txt
- Sun Communities 2025-07-23 Form 8-K: https://www.sec.gov/Archives/edgar/data/912593/000091259325000199/sui-20250720.htm
- Sun Communities CEO transition announcement: https://www.globenewswire.com/news-release/2025/07/23/3120644/0/en/sun-communities-inc-announces-ceo-transition.html
- Marriott FY2025 results: https://marriott.gcs-web.com/news-releases/news-release-details/marriott-international-reports-fourth-quarter-and-full-year-2025
- Wyndham 2025 annual report: https://investor.wyndhamhotels.com/financial-information/all-sec-filings/content/0001722684-26-000052/a2025annualreport.pdf