
We Built an AI Options Assistant with QVeris
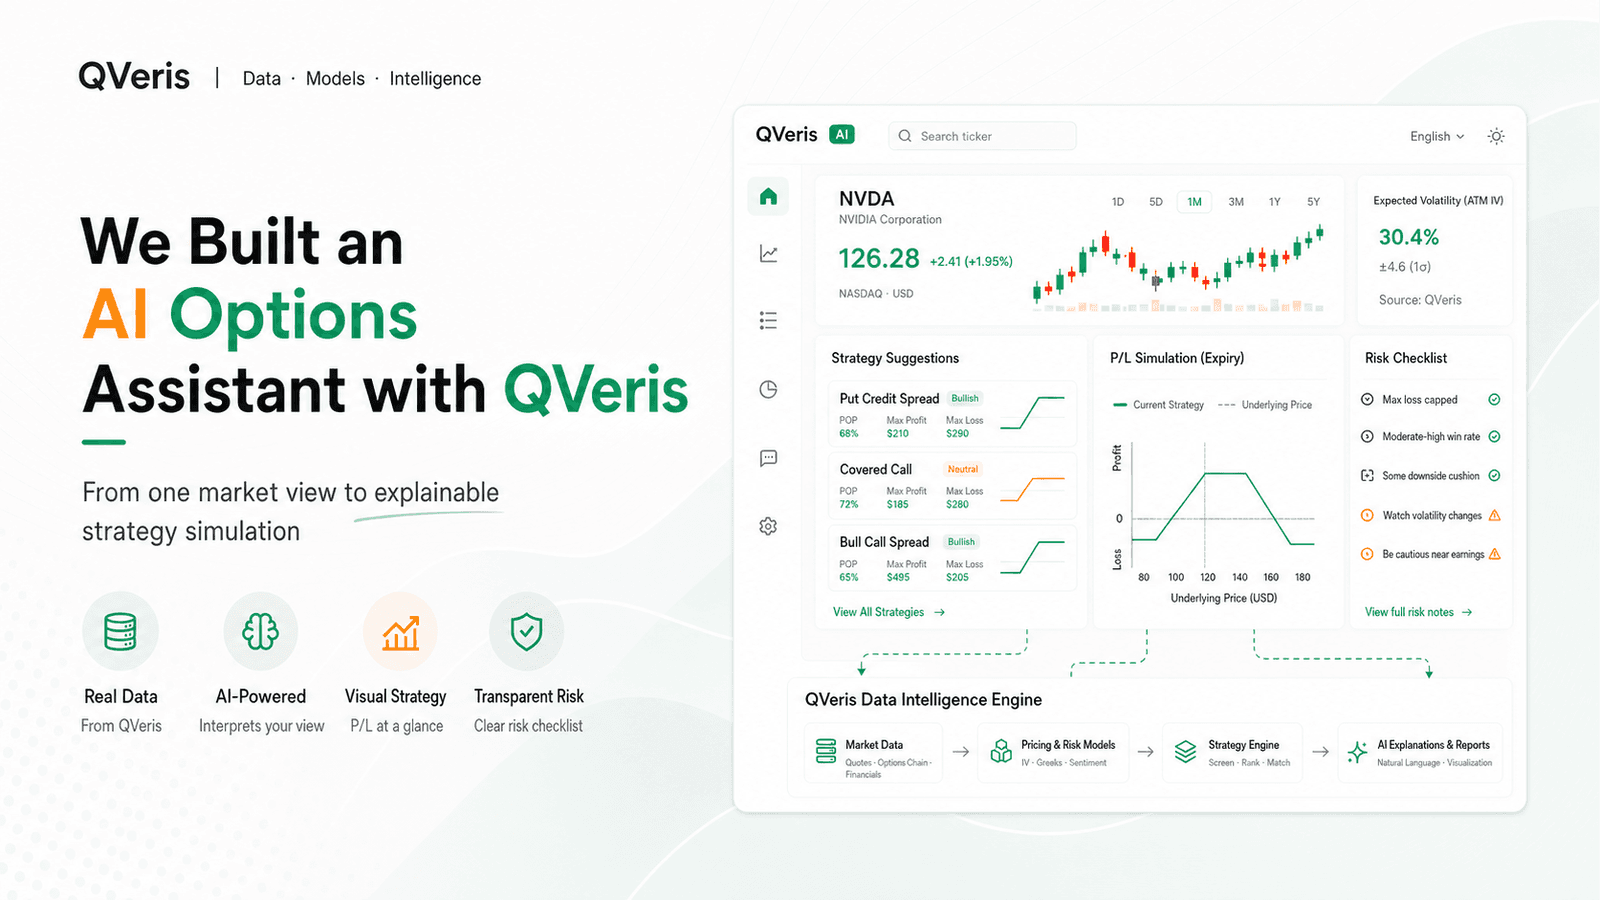
An AI financial product experiment: split "I am bullish on NVDA, but I only want to lose $500 at most" into data, strategy, simulation and risk boundaries.
Project review | Graphic version | 2026-07-03
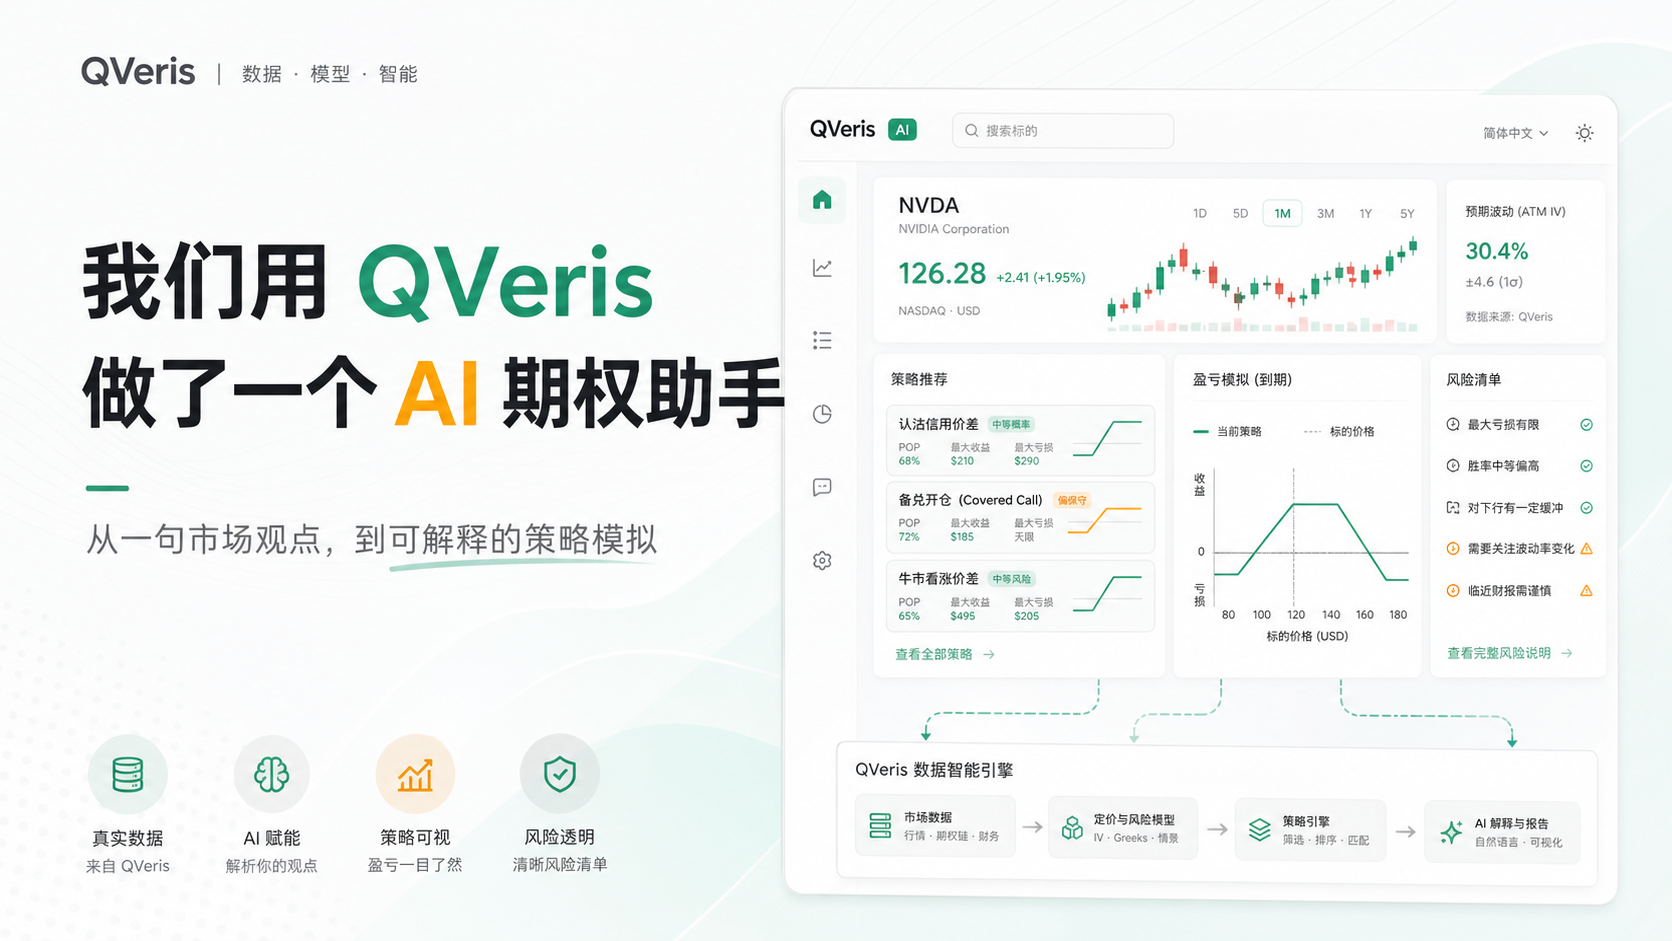
We used QVeris to build an AI option assistant
In the past period of time, we have been conducting a very specific experiment:
**Can AI not only explain the concept of options, but also translate a real market view into a set of options strategies that are comparable, simulated, and repeatable? **
This thing sounds like a chat product, but when you actually do it, you will soon find that it is not as simple as "asking the model to write a few more paragraphs of explanation."
Because options are not simply about judging the rise or fall.
It also involves price, time, volatility, strike price, expiry date, premium, maximum loss, break-even point and liquidity.
A user may say only one sentence:
I'm bullish on NVDA with a one-month target of 210, but I only want to lose $500 at most.
But behind the system must answer:
- What is the current price?
- How far is the target price from the current price?
- What expiration date does this time window correspond to?
- Buy Call, do Call Spread, or consider other structures?
- Does the maximum loss exceed the user's budget?
- How far does it go before expiration to really make money?
- What happens if the direction is right but the increase is not enough?
- Which data is truly obtained, and which data cannot be edited by AI?
This is our starting point for QVeris AI Options Assistant.
It is not a chat box that only gives conclusions, but a research workbench that breaks down market views into strategic structures, calculation results and risk boundaries.
01 | Let’s start with a real example
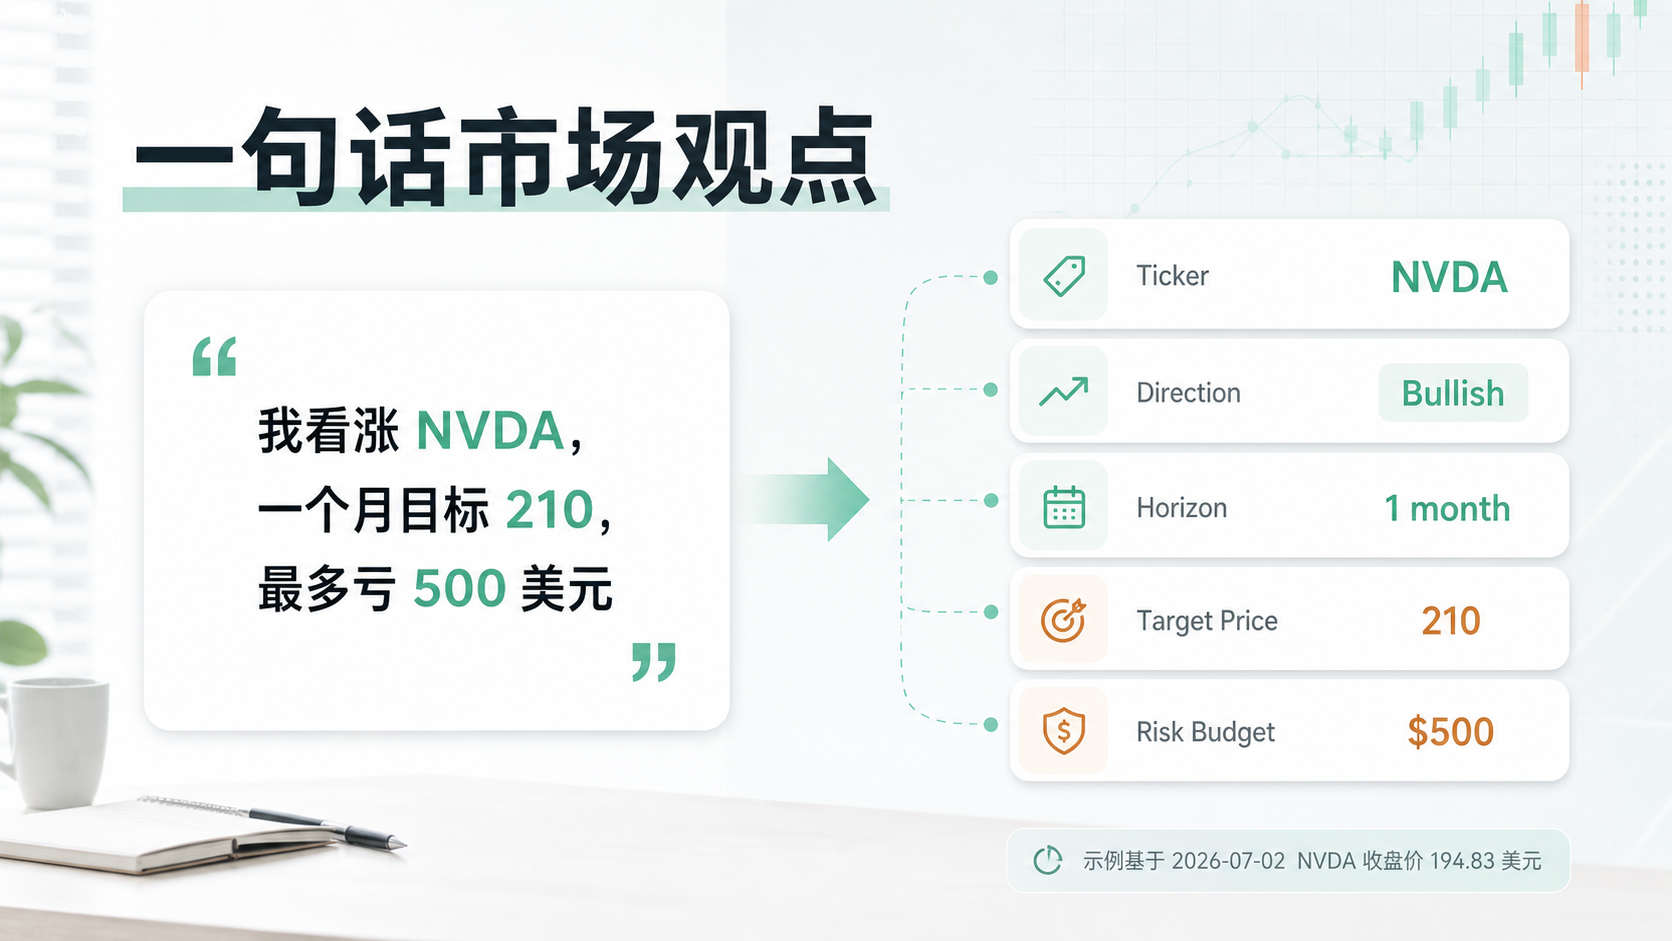
A market perspective
In order to avoid writing a vague demo, we first use real market conditions as an example.
Through the QVeris market route in the current project, the market snapshot of NVDA at 2026-07-02 20:29 UTC is as follows:
| field | value |
|---|---|
| Latest price | $194.83 |
| Previous Close | $197.58 |
| Opening of the day | $197.14 |
| Highest of the day | $200.06 |
| Lowest of the day | $192.35 |
| Change of the day | -$2.75 |
| Raise or fall on the day | -1.39% |
| Trading volume | 139,595,163 |
| Data Source | QVeris |
Based on this price, the user enters:
I am bullish on NVDA with a one month target of 210 and a loss of $500 at most.
The system must first split the natural language into structured fields:
| field | parsing result |
|---|---|
| Ticker | NVDA |
| Current Price | 194.83 |
| Directions | Bullish |
| time window | 1 month |
| Target Price | 210 |
| Risk Budget | $500 |
| Experience level | beginner default |
This step is not to "appear smart", but to allow the subsequent calculations to have boundaries.
Without the current price, the target price has no reference.
Without a time window, there is no way to choose an expiration date.
Without a risk budget, the system doesn't know which strategies should be excluded or alerted.
For AI in financial products, the first step is not to rush to answer, but to ask the question clearly.
02 | We break the process into five steps
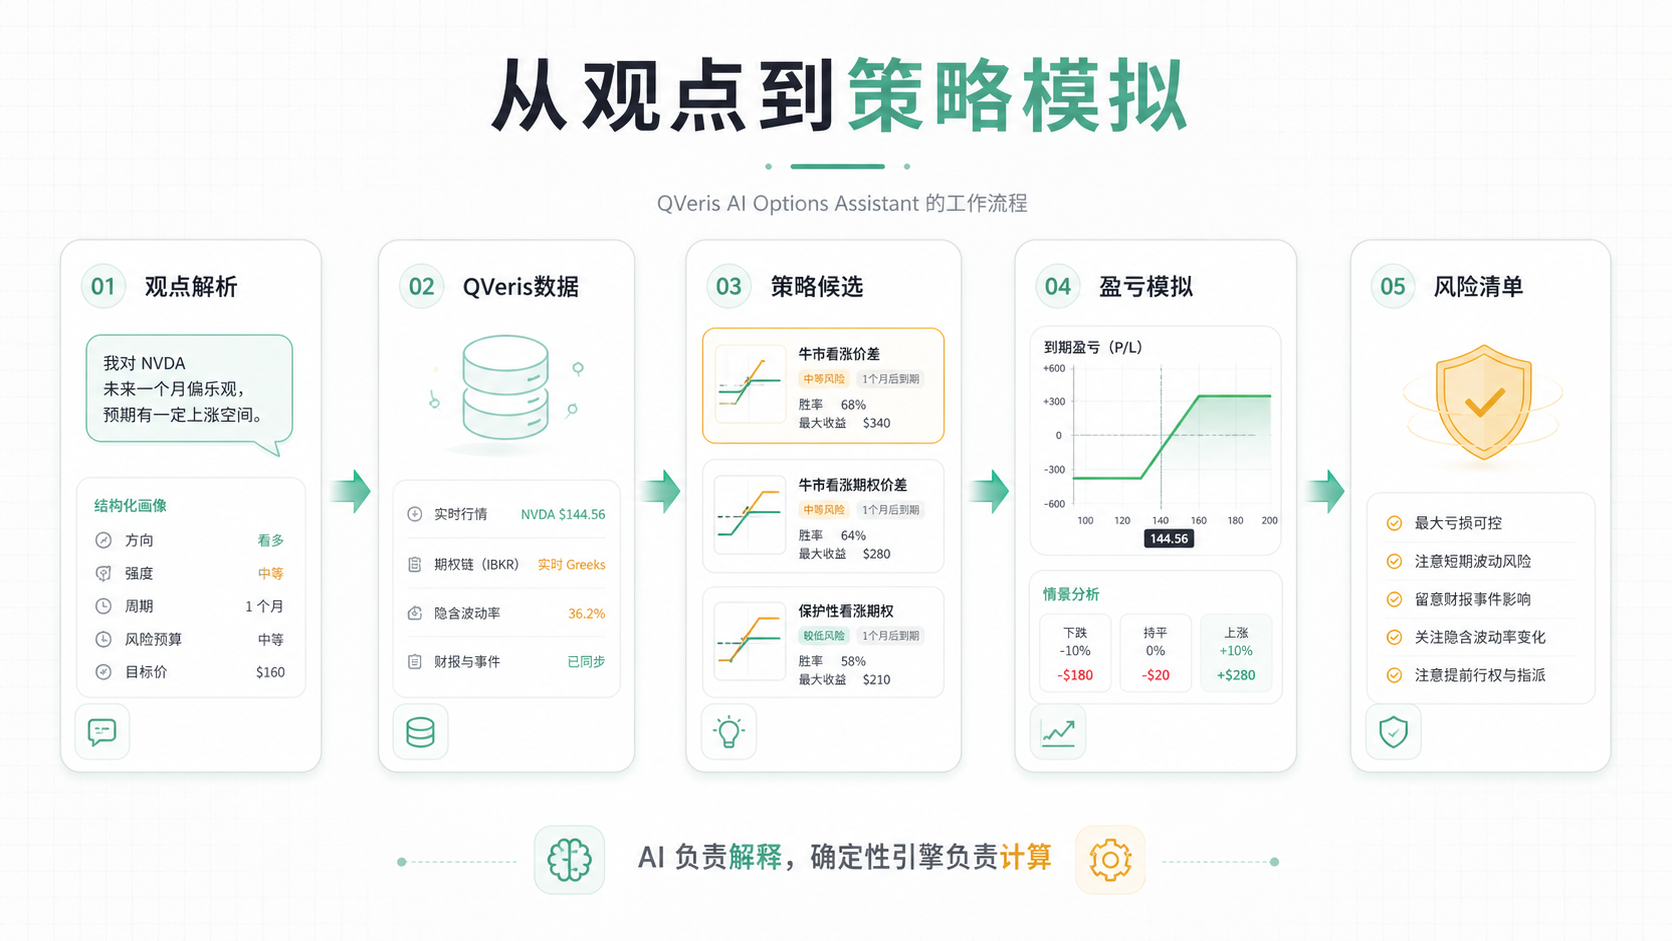
From viewpoint to strategy simulation
The core process of this version of Option Assistant is very simple:
**Step one: Analyze the point of view. **
Convert natural language into fields such as ticker, direction, strength, target price, time window, risk budget, experience level, etc.
**Step 2: Access data. **
QVeris data capabilities for market conditions and K-line movements. The option chain in the current prototype still uses the local development path for verification, and the subsequent goal is to continue to complete the QVeris option data path. Regardless of the source, the principle is the same: data that is not truly available cannot be made up by the model.
**Step 3: Generate strategy candidates. **
The system does not give just one "answer" but compares different risk structures together. For example, if you are bullish on NVDA, you can look at Long Call, Bull Call Spread, or under certain conditions, you can look at Covered Call or Cash-Secured Put.
**Step 4: Do profit and loss simulation. **
Each strategy must be able to see the maximum loss, maximum profit, break-even point, target price profit, expiration scenario table, and simulation results under price and time changes.
**Step 5: Generate risk explanations. **
AI is responsible for making the results clear, but it cannot replace deterministic calculations. Maximum drawdown, breakeven, payoff, scenario table These numbers must come from the engine or data source.
When these five steps are put together, you will have a working options assistant.
03 | What we make is not a chat box, but a workbench
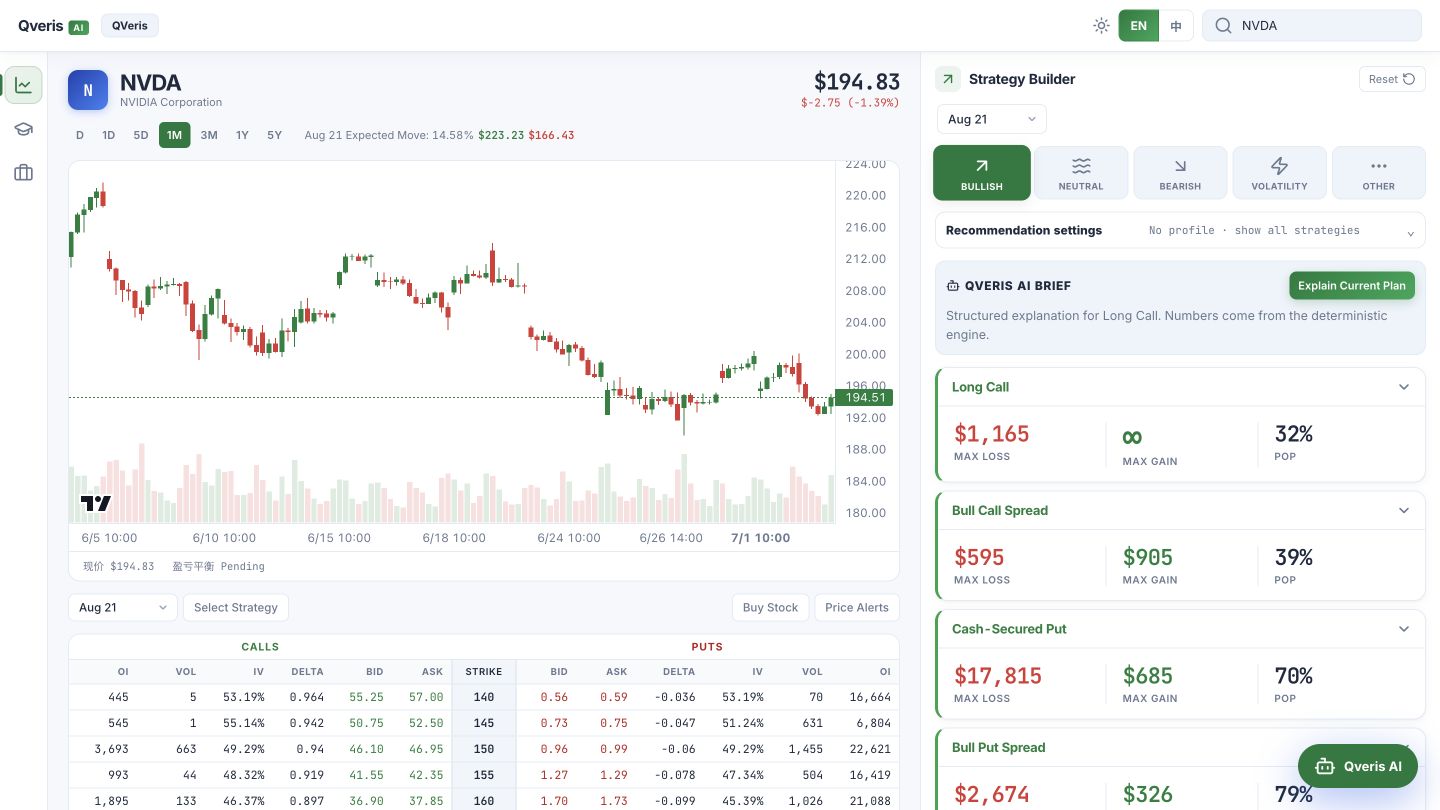
Option Assistant Workbench
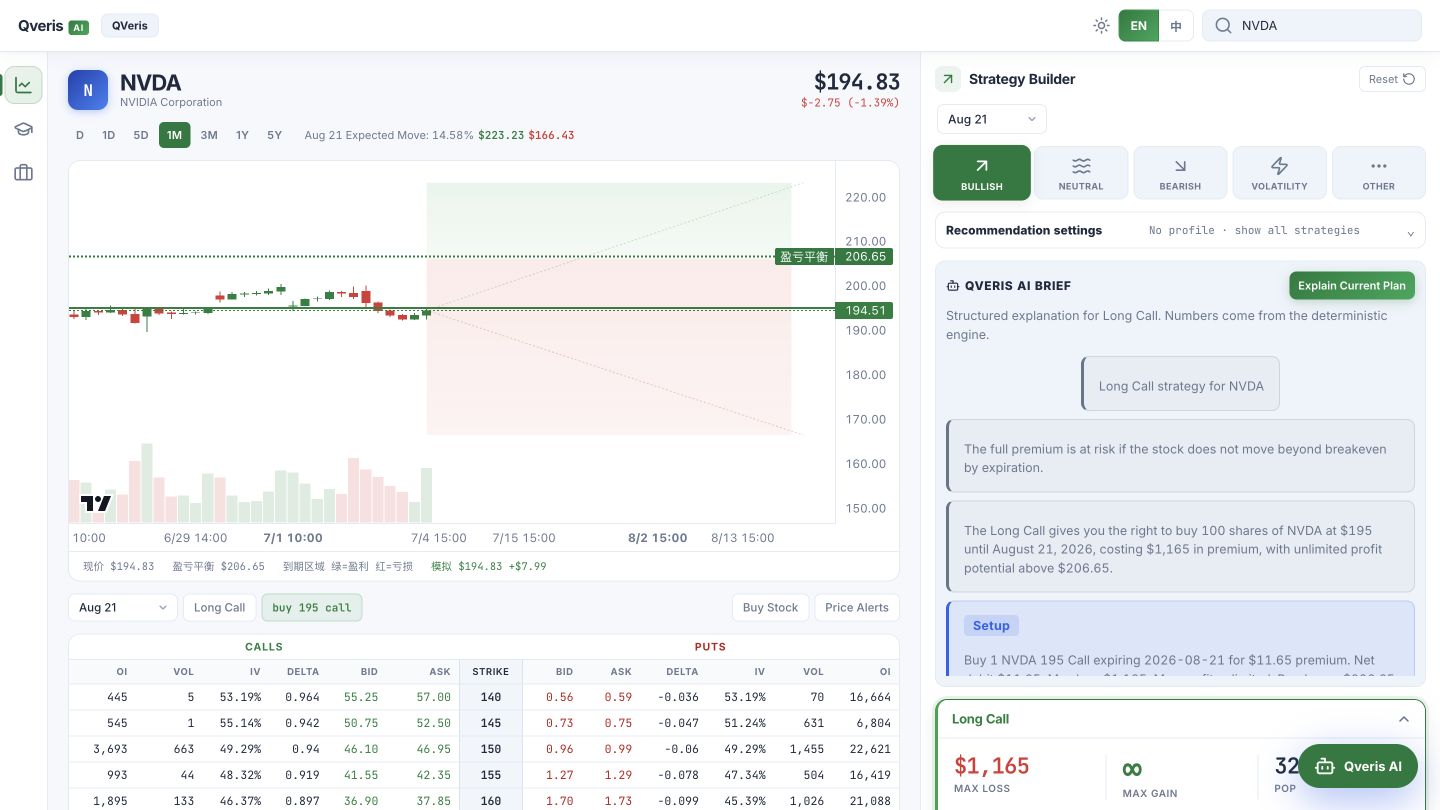
Currently, this version of the prototype has run through the main workbench:
- The left side displays NVDA quotes, K-lines and option chains.
- Intermediate hosting strategy construction and chart simulation.
- Shown on the right are Strategy Builder and QVeris AI Brief.
- The Paper Trade portal is used to save strategy ideas for subsequent review.
We did not design it as a chat window where "you ask a question and the AI will reply with a paragraph".
The reason is simple:
Options strategy cannot be explained in one paragraph. Users need to see data, charts, strategy legs, costs, return ranges, and risk tips all at the same time.
This is also our biggest product judgment for this project:
**The real difficulty of AI financial products is not to make the model speak like an expert, but to make it work within real data, deterministic calculations and clear risk boundaries. **
#04 | Strategy is not an answer, but a set of comparisons
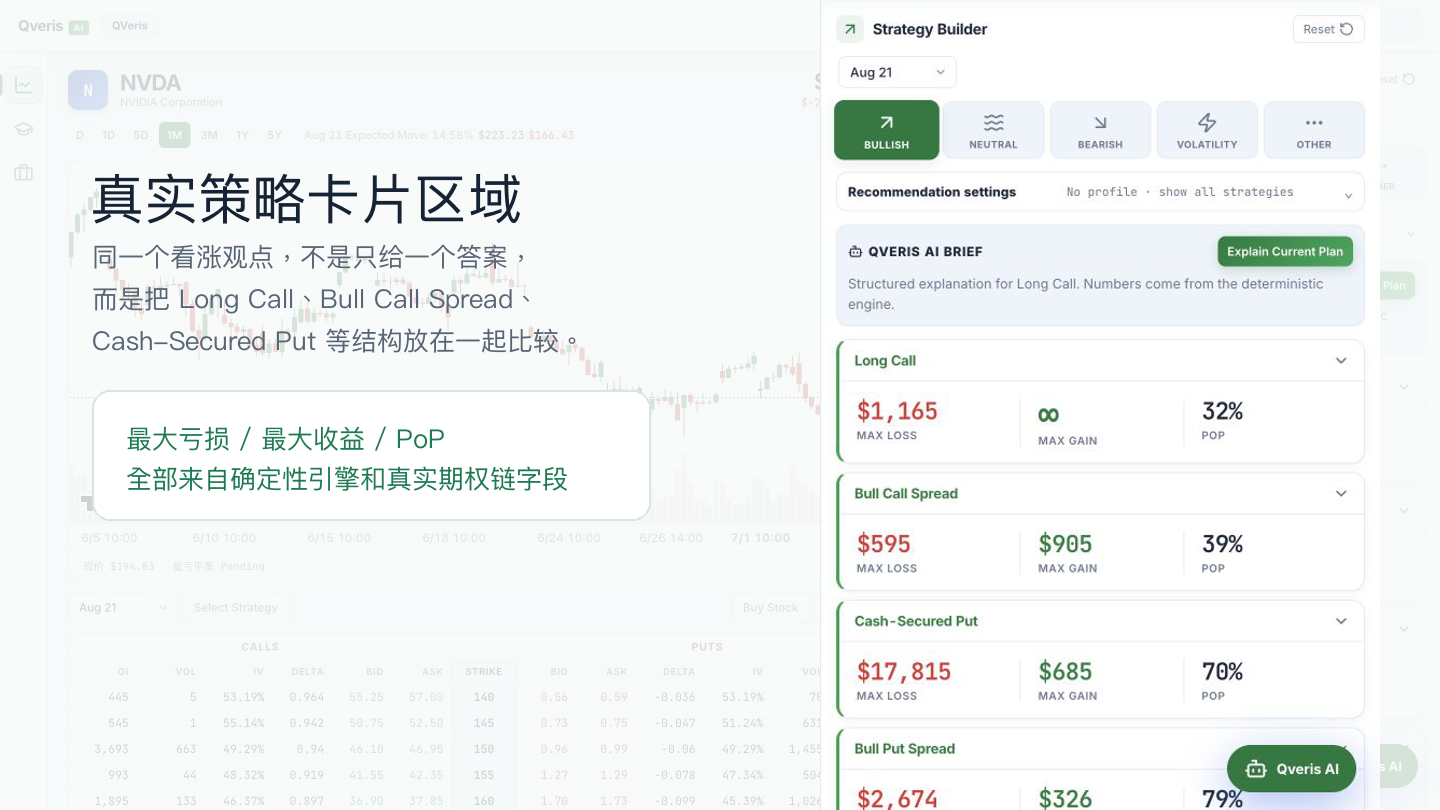
Strategy card comparison
When a user says "bullish NVDA", it does not mean that the system should only display a Long Call.
Because they are both bullish, different strategies express completely different risk-return structures:
| Strategy | More suitable scenarios | Users must see clearly |
|---|---|---|
| Long Call | Strongly bullish, willing to bear the full loss of the premium | Only when the price rises above the break-even point can real money be made |
| Bull Call Spread | Mild to moderately bullish, hoping maximum losses are controllable | Upside gains capped |
| Covered Call | I already hold 100 shares of the underlying stock and want to increase my income | When the underlying stock continues to rise sharply, the upper income may be limited |
| Cash-Secured Put | Willing to take the stock at a lower price | Need to bear the risk of being assigned to buy the underlying stock |
Therefore, we prefer this product to be like a Strategy Translator.
It does not directly tell the user "which one to do", but breaks down the structure of each strategy:
- Why is it relevant to the current point of view?
- How much will it cost?
- Where is the biggest loss?
- Is the break-even point reasonable?
- If it only rises slightly, will it still be a loss?
- Is this strategy too aggressive for newbies?
The value of Option Assistant is not to give an answer that looks smart, but to lay out the risk structure behind the answer.
05 | Look at the maximum loss first, then the potential profit
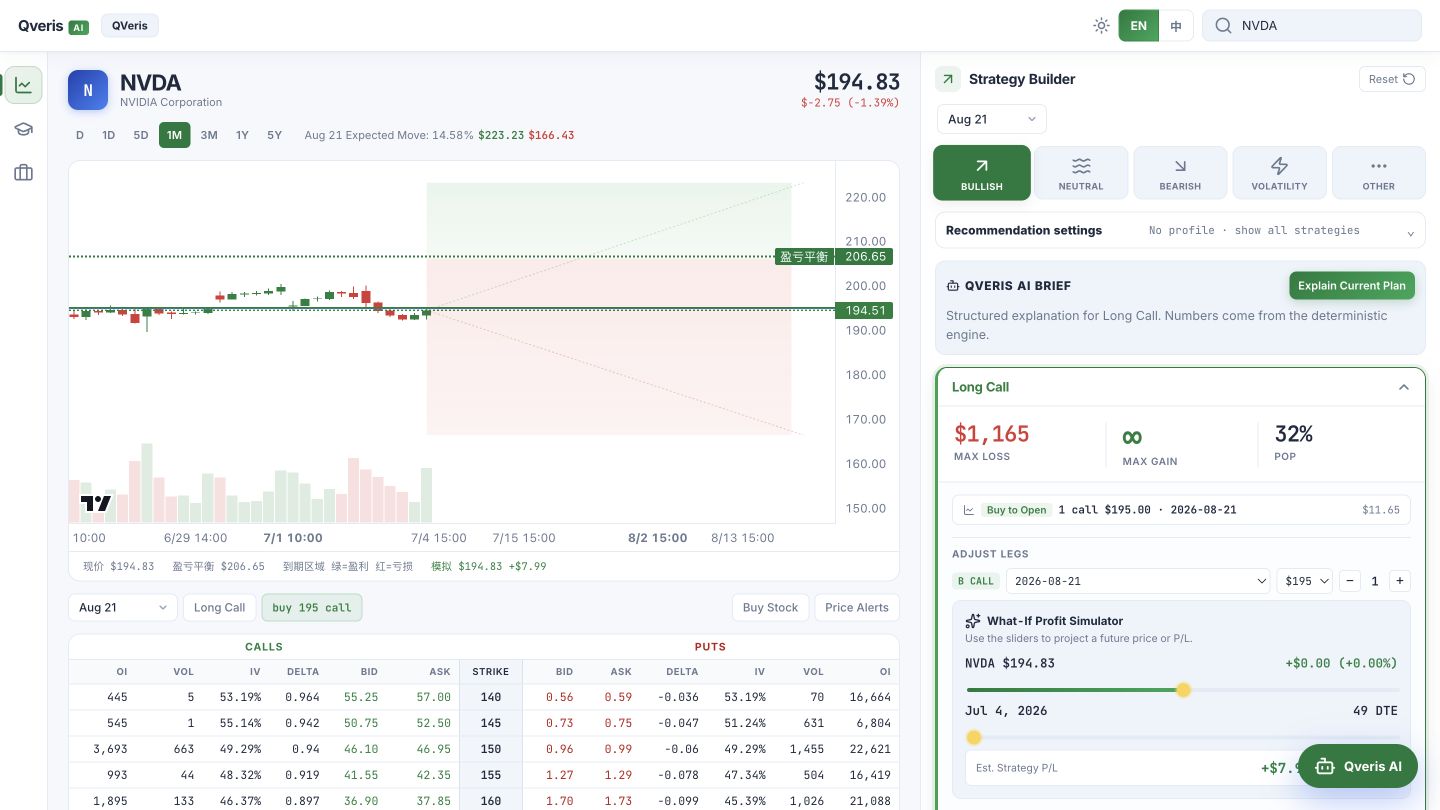
Profit and loss simulation
Newcomers to options are most likely to be attracted by "potential gains."
But in the product, we hope that the first thing users see is the maximum loss.
So the payoff, scenario table and simulator are placed in the strategy card so that the user can see:
- How much profit or loss will the strategy make when the underlying price reaches different positions.
- How the value of time changes as the expiration date approaches.
- What happens to the theoretical price when IV rises or falls.
- When the target price is reached, does the strategy really make money?
- If the direction is correct but the amplitude is not enough, will there be a loss?
There is a very important boundary here:
**AI can be responsible for interpretation, but the key numbers must come from a deterministic engine. **
For example, maximum loss, break-even point, expiration payoff, scenario table, these should not be freely generated by large models.
Models can illustrate them, but they cannot invent them.
#06 | Why QVeris is critical to this project
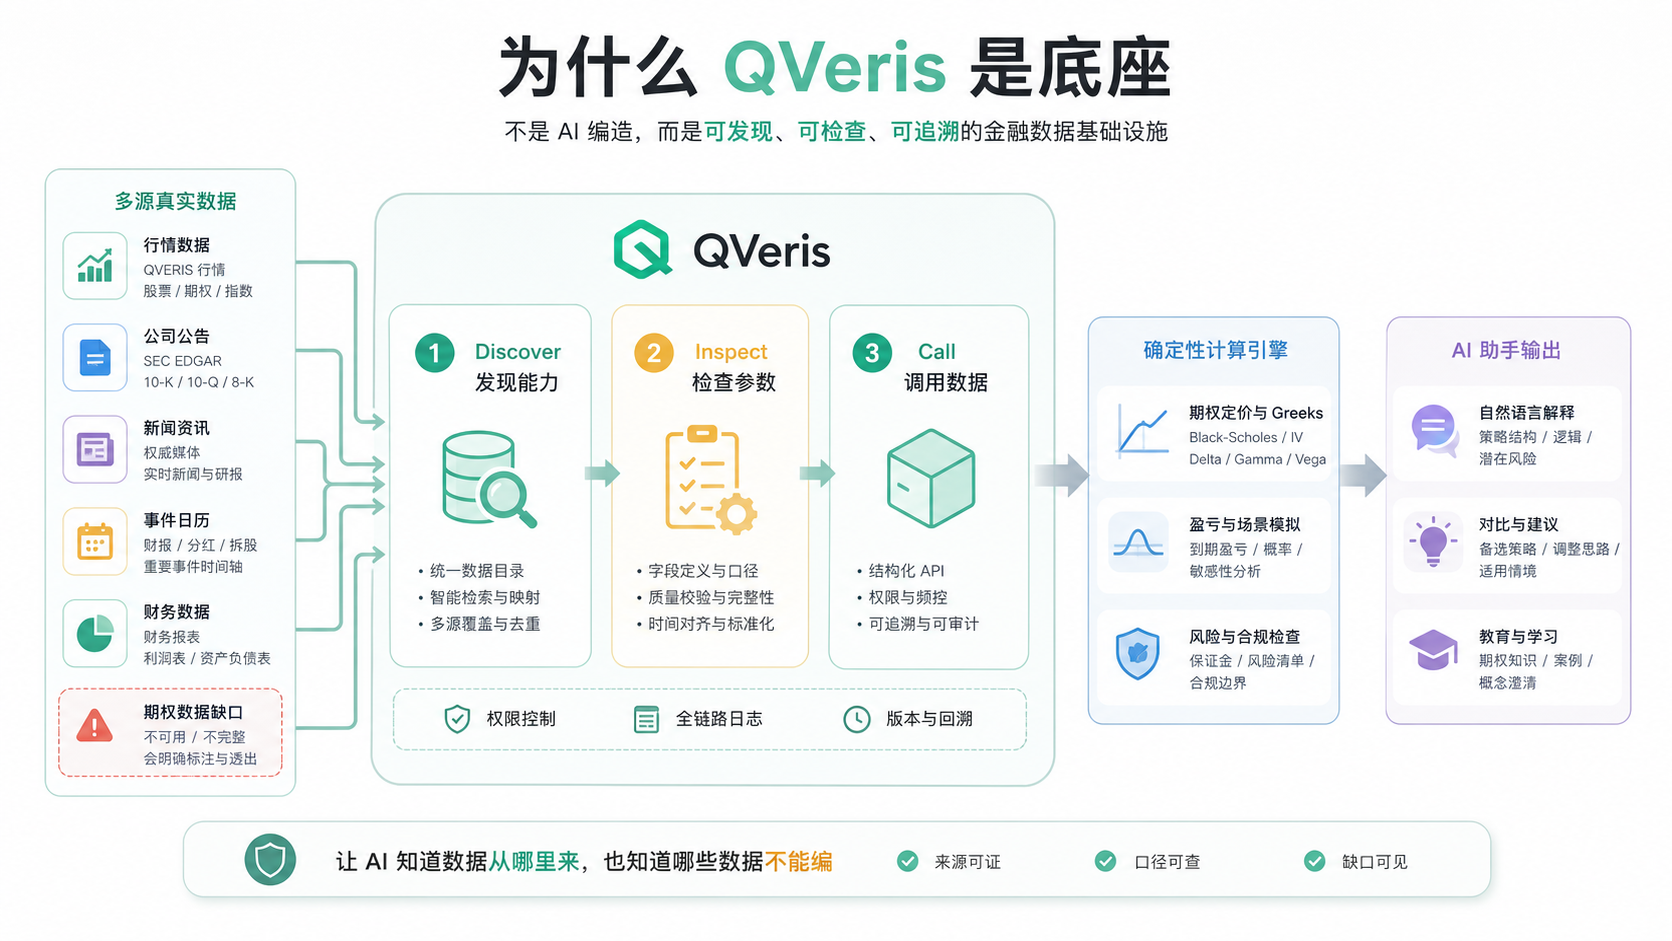
Why QVeris is the base
After completing this round, we feel more clearly: the underlying difficulty of AI financial products is data capabilities.
It's not as simple as "is there an API", but the Agent needs to know:
- What data capabilities are available?
- What does each tool check?
- How to pass parameters?
- What are the return fields?
- Where does the data come from?
- Which fields are missing?
- When should you stop instead of continuing?
This is exactly the value of QVeris in this project.
QVeris organizes financial data capabilities into workflows that Agents can use:
**Discover: Discovery ability. **
First know what tools are available to check market prices, company information, financial reports, news, events and other information.
**Inspect: Inspection capabilities. **
Before calling, read the tool parameters, return structure, applicable boundaries and calling rules.
**Call: Call ability. **
Make calls when the data is actually needed, and keep sources, results, and gaps in the process.
This takes AI financial applications a step further from "being able to write financial text" to "being able to check data, use tools, and retain evidence."
This is especially important for options assistants.
Because once AI starts to compile prices, Greeks, and probabilities, what users see is no longer research assistance, but the risk itself.
07 | We deliberately retained data gaps
We didn’t let AI make up the answers
When working on this project, we felt that the most important thing was to let the system admit what it didn't know.
Especially options data:
- option price
- bid / ask
- implied volatility
- delta / gamma / theta / vega
- open interest
- probability
- strike
- expiration
These fields, without real data, don’t allow the AI to “reasonably estimate” a number that looks real.
So we made several hard boundaries in the project:
| Border | Processing |
|---|---|
| A key field is currently unavailable | Marked QVERIS_DATA_GAP |
| Option chain quotes are missing | Do not forge bid / ask |
| Greeks are missing | Don’t let AI fill them in |
| Strategy exceeds risk budget | Must prompt, not described as suitable |
| Novice users | 0DTE or naked selling strategies are not recommended by default |
| Current stage | Only doing research, education, simulation and Paper Trade |
This sounds less exciting than "fully automated trading", but for financial products, restraint itself is the ability.
If an AI can only speak beautifully but does not know which data cannot be edited, the smoother it is, the more dangerous it will be.
08 | Next step: Make the Demo a reproducible research tool
Next step roadmap
This version of Option Assistant is just the starting point.
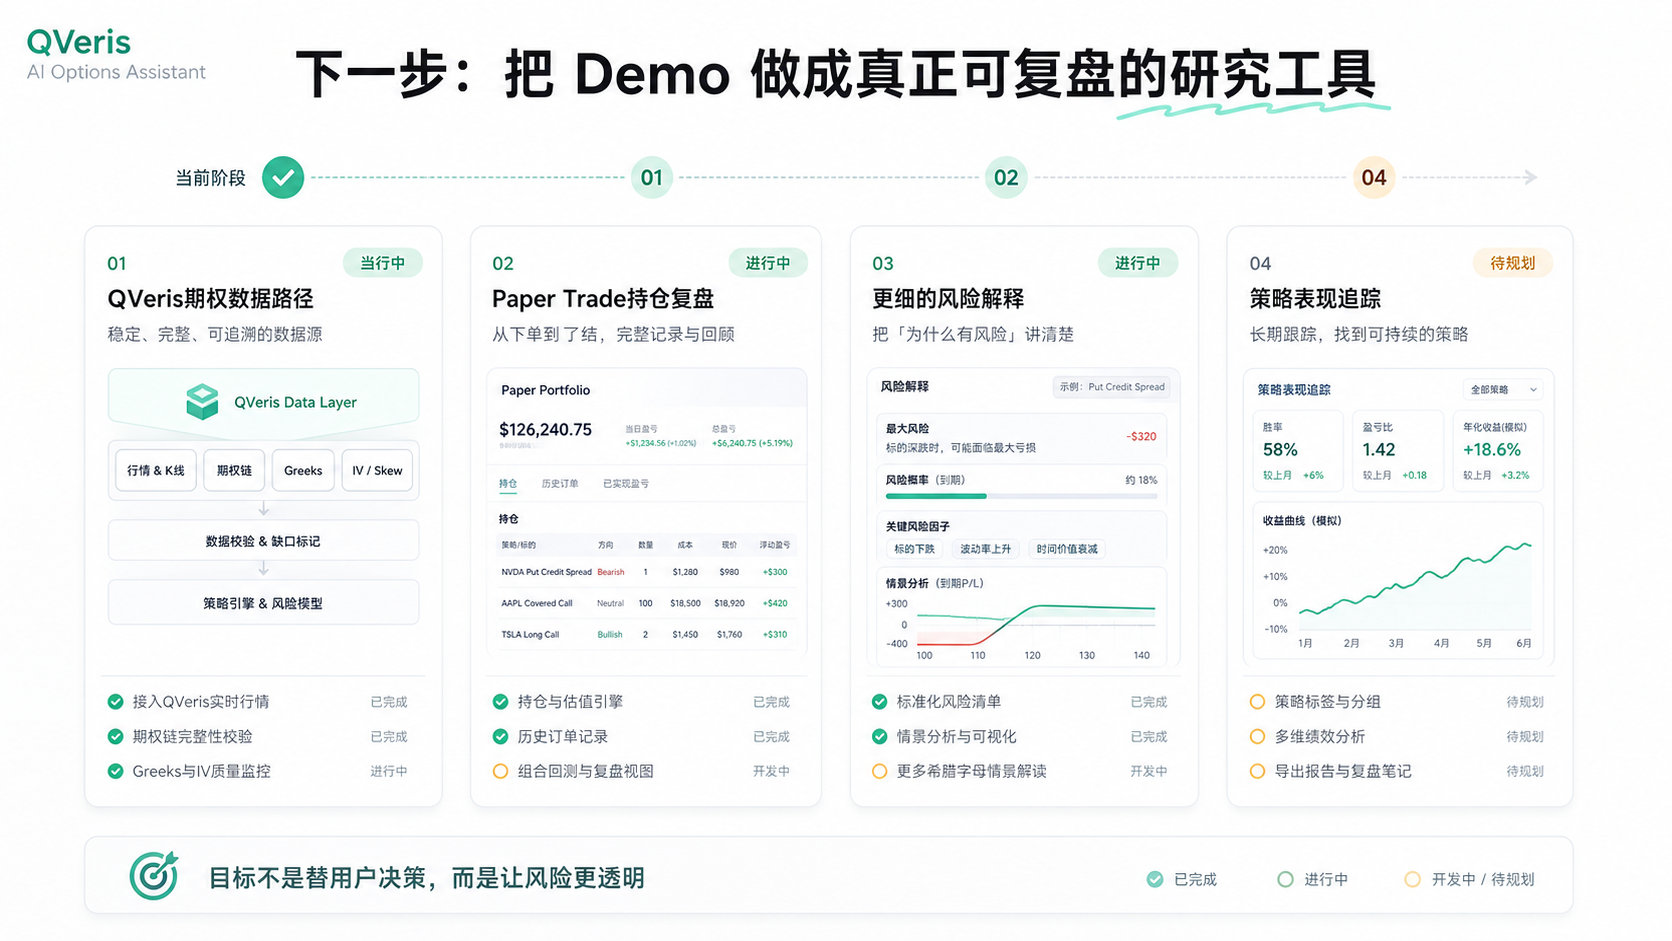
Next, we are most concerned about four things:
**First, continue to complete the QVeris option data path. **
The long-term goal is to enable quotes, option chains, IVs, Greeks, OI, events and financial reports to be discovered, inspected and called in a unified data workflow.
**Second, make Paper Trade a real review system. **
What users save should not just be a screenshot of the strategy, but should be able to track the opening assumptions, subsequent underlying trends, changes in the theoretical value of the strategy, closing results and review conclusions.
**Third, let the risk explanation be more detailed. **
For example, IV crush, Theta decay, assignment, liquidity, financial reporting events, and the loss range of straddle strategies should all be explained more specifically.
**Fourth, precipitation strategy performance. **
The same is bullish, but the results of Long Call, Call Spread, and Covered Call are different under different market environments. We hope to change the strategy from "generate once" to "continuous review" in the future.
#End
After doing this during this period, our biggest feelings are:
**The core of AI financial products is not to make decisions for users, but to allow users to clearly see the data, structure and risks before making decisions. **
Option Assistant is just a starting point.
The problem behind it is bigger:
When AI begins to enter investment research, strategic analysis and financial tools, what really matters is not “whether AI can speak finance”, but:
- Where does its data come from?
- Is its calculation certain?
- Are its risk boundaries clear?
- Does it know what it doesn't know?
This is why we chose QVeris for this project.
QVeris is not simply adding a data interface to AI, but is helping to build a more reliable base for AI financial applications: discovery capabilities, inspection capabilities, calling capabilities, and leaving data paths and evidence gaps in the workflow.
We hope this options assistant will eventually become a truly useful research tool:
It’s not about making judgments for users.
Rather, it makes every judgment more transparent, explainable, and reviewable.
This article is only a product development review and financial knowledge discussion, and does not constitute any investment advice, trading advice or return commitment. The NVDA examples in this article are only used to illustrate the product flow.