
Backtesting with QVeris Data: Understand the Data Before Trusting the Curve
Before a Curve Appears, Ask Three Questions
Many people conducting factor or strategy backtests want to see the profit curve first. However, a truly valuable backtest isn't complete once the curve is drawn—it requires clearly explaining the data behind the curve.
What stock pool was used? Is the daily K-line coverage sufficient? Are there enough candidate stocks available on rebalancing dates? If these issues aren't addressed properly, even a seemingly complete backtest result may represent a misleading conclusion.
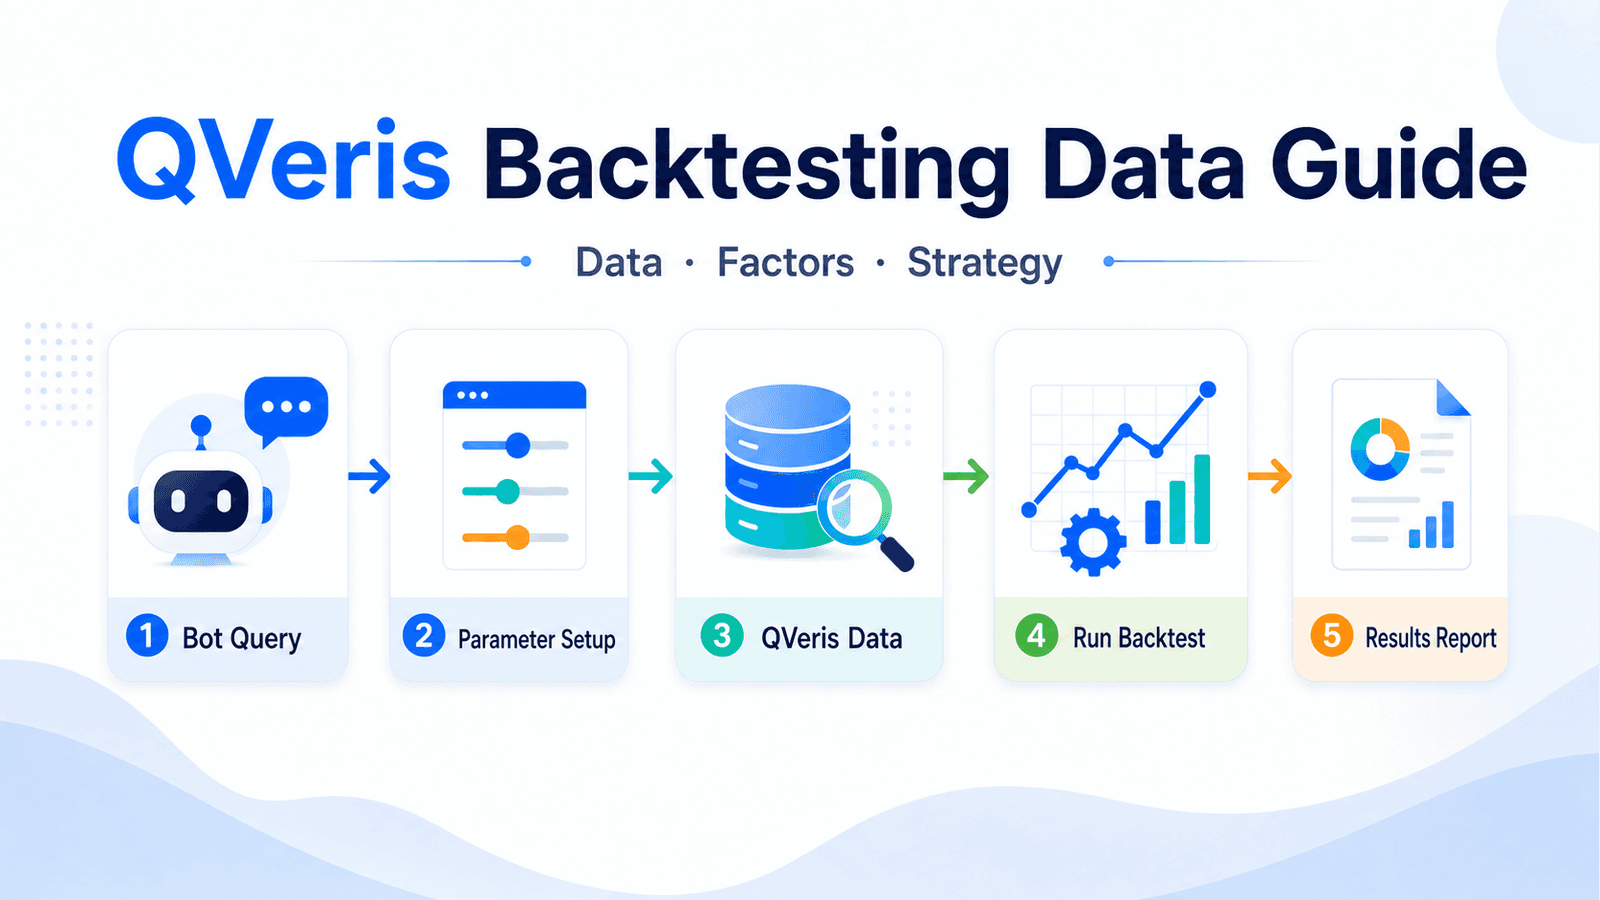
QVeris is better understood as the foundational data layer for backtesting: it provides local market data, trading calendars, stock pools, factor data, and coverage information for Bots or callers to complete condition checks, execute backtests, and interpret results.

What Data Does QVeris Provide for Backtesting?
When conducting backtests, QVeris offers more than a single market data field—it provides a set of data usable in the backtesting workflow: market data, trading calendars, stock pools, factor values, and coverage information.
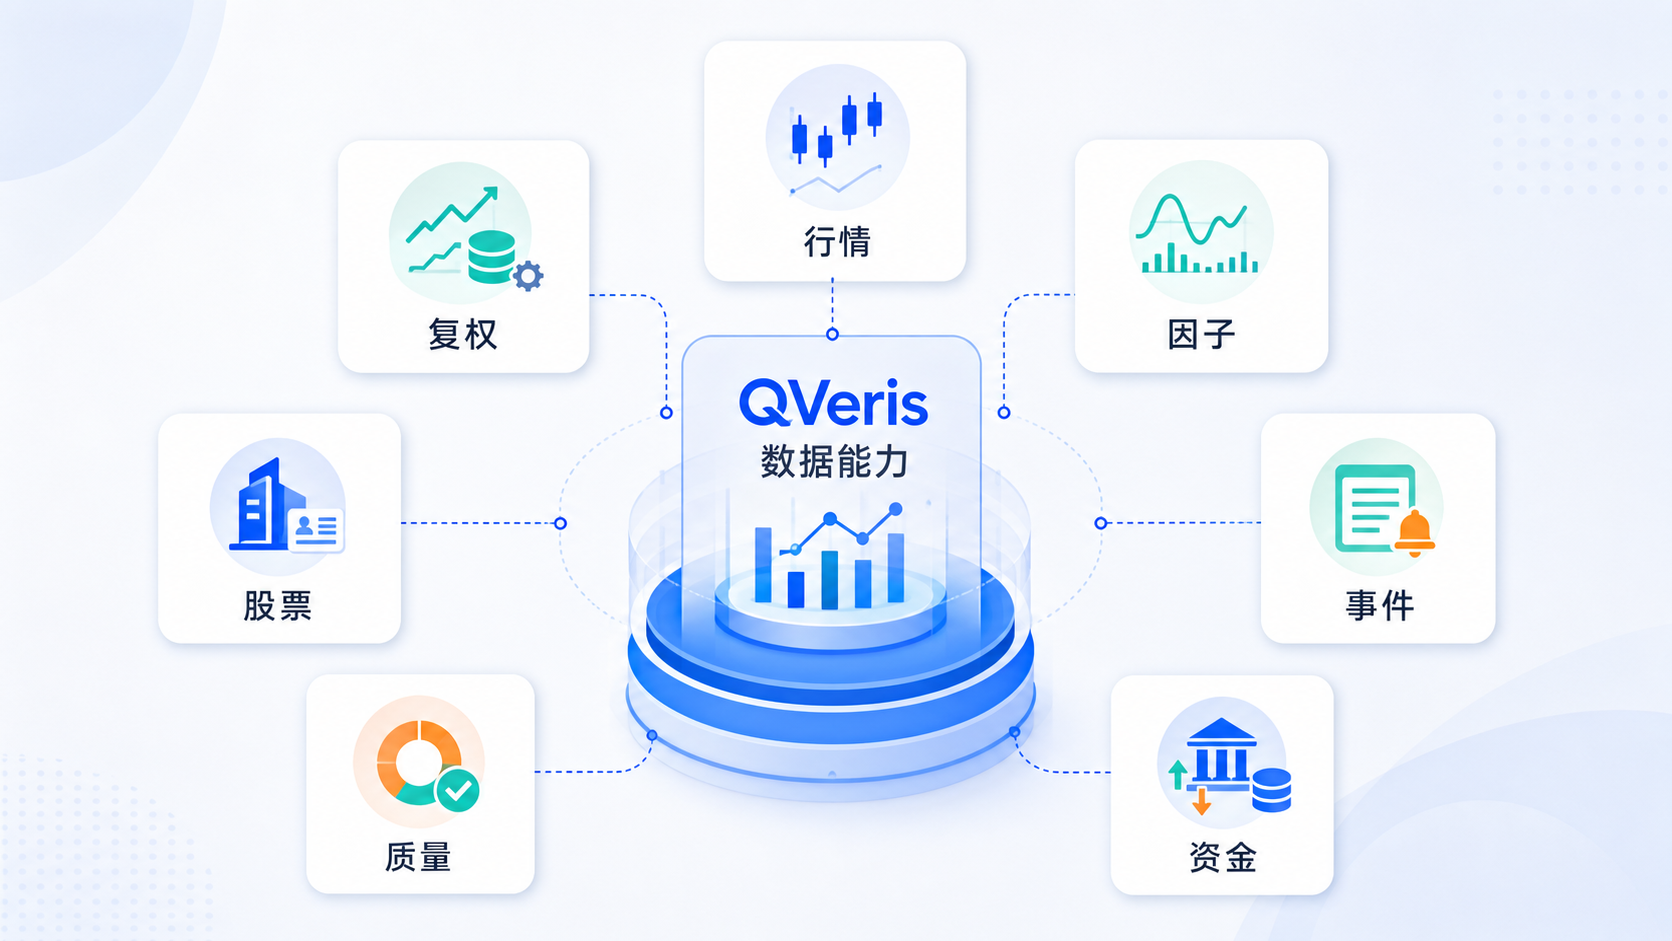
- Local daily K-lines: Used to calculate individual stock price changes, rebalancing returns, and risk metrics within the backtest period.
- Trading calendar: Determines the backtest window, rebalancing dates, and available trading days, avoiding non-trading days as valid samples.
- Stock pool: Defines the candidate universe, such as CSI 300, all-market, or a user-specified stock group.
- Factor data: Ranks stocks at each rebalancing point to determine which stocks enter Top N or strategy positions.
- Data quality information: Flags insufficient samples, incomplete coverage, or too few backtestable stocks, helping assess result reliability.
Thus, whether a backtest result is valid depends not on how high the return is, but on whether the data sufficiently supports the analysis.
You Can Directly Ask the Bot This Way
For a quick check on whether a factor has directional sense, ask concisely:
Please backtest the quality factor using QVeris data, with CSI 300 as the stock pool, covering the past year, rebalancing every 20 trading days, and selecting Top 30.
If you have a specific strategy, provide more precise constraints:
Please validate a low-valuation plus profitability quality strategy using QVeris data: screen by P/E from low to high, filter by ROE, select Top 20, rebalance monthly, backtest the past three years, and provide maximum drawdown and portfolio holdings at each rebalancing.
If data sufficiency is your concern, check first before running:
First check if local data supports backtesting a Chinese A-share strategy for the past year—report the number of stocks covered, trading days, and whether Top 30 is feasible.
What a Backtest Typically Involves
When a Bot initiates a backtest using QVeris data, the process doesn't directly calculate returns—it first performs a data check. This takes slightly longer but prevents discovering insufficient samples after results are generated.
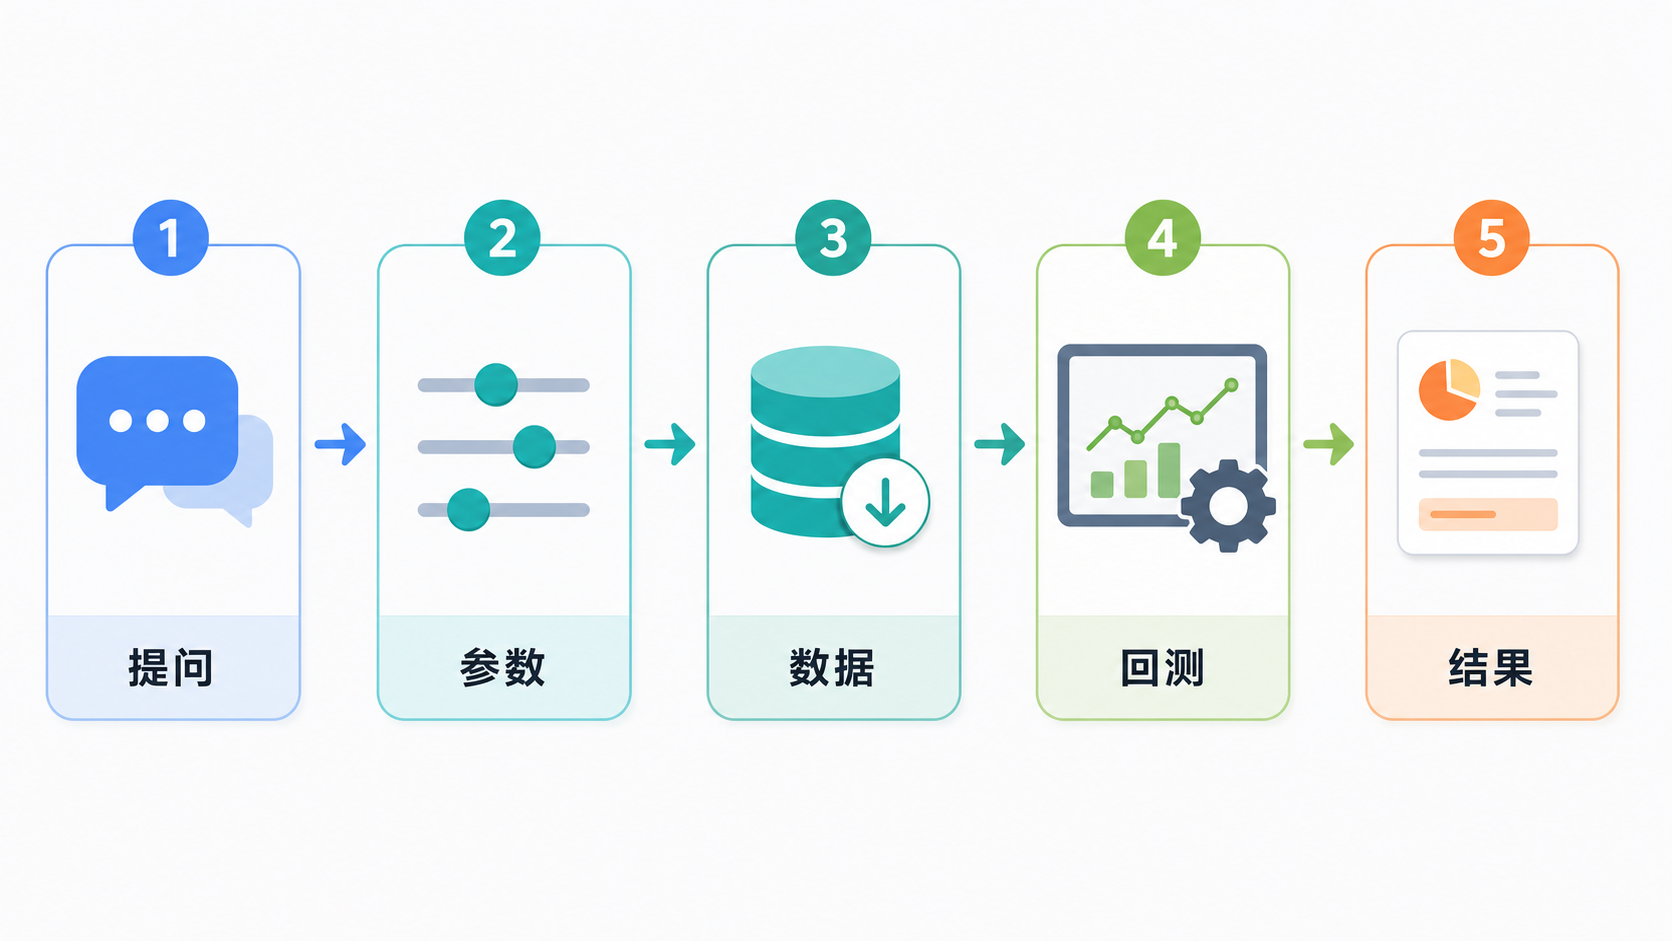
- Confirm your backtest objective: factor, strategy, stock pool, period, rebalancing frequency, and holding count.
- Check local market data and trading calendar coverage to determine if current data supports the task.
- If data is insufficient, clearly explain the gap instead of forcing a curve.
- If data meets requirements, proceed with factor preview or strategy backtest.
- Return results with profit performance, risk metrics, portfolio changes, and quality prompts.
The key focus is interpretability. You don't need to judge all technical details upfront—just verify whether the Bot explains "what data was used, which samples were filtered, and why the backtest succeeded or failed."
What to Focus on in Factor Backtesting
Factor backtesting is better suited to answer "Does this signal have sorting power?" It may not equal a full strategy, but it quickly helps determine if a direction merits further research.
- Group or Top N performance: Check whether high-score groups consistently outperform low-score groups; avoid fixating on a single high return.
- Rebalancing sample size: Verify that enough stocks participated in ranking at each rebalancing; conclusions should be discounted when samples are small.
- Maximum drawdown: Assess whether returns came at the cost of excessive volatility.
- Coverage prompt: If the result flags insufficient samples or trading days, address data gaps before proceeding.
If a factor only performs well on a few stocks or dates, don't rush to declare it effective. A more reliable approach is to test with different stock pools, periods, or Top N sizes to confirm consistency.
What to Focus on in Strategy Backtesting
Strategy backtesting more closely mirrors real-world use. It cares not only about "what to buy" but also "when to buy, when to switch, and which stocks to hold each time."
When reviewing strategy backtest results, follow this order:
- First, check the backtest period and stock pool to confirm alignment with your question.
- Then, review annualized returns, maximum drawdown, volatility, and win rate—not just final returns.
- Next, examine rebalancing records to confirm trading frequency and concentration.
- Finally, assess data quality prompts to determine if results are reliable for next steps.
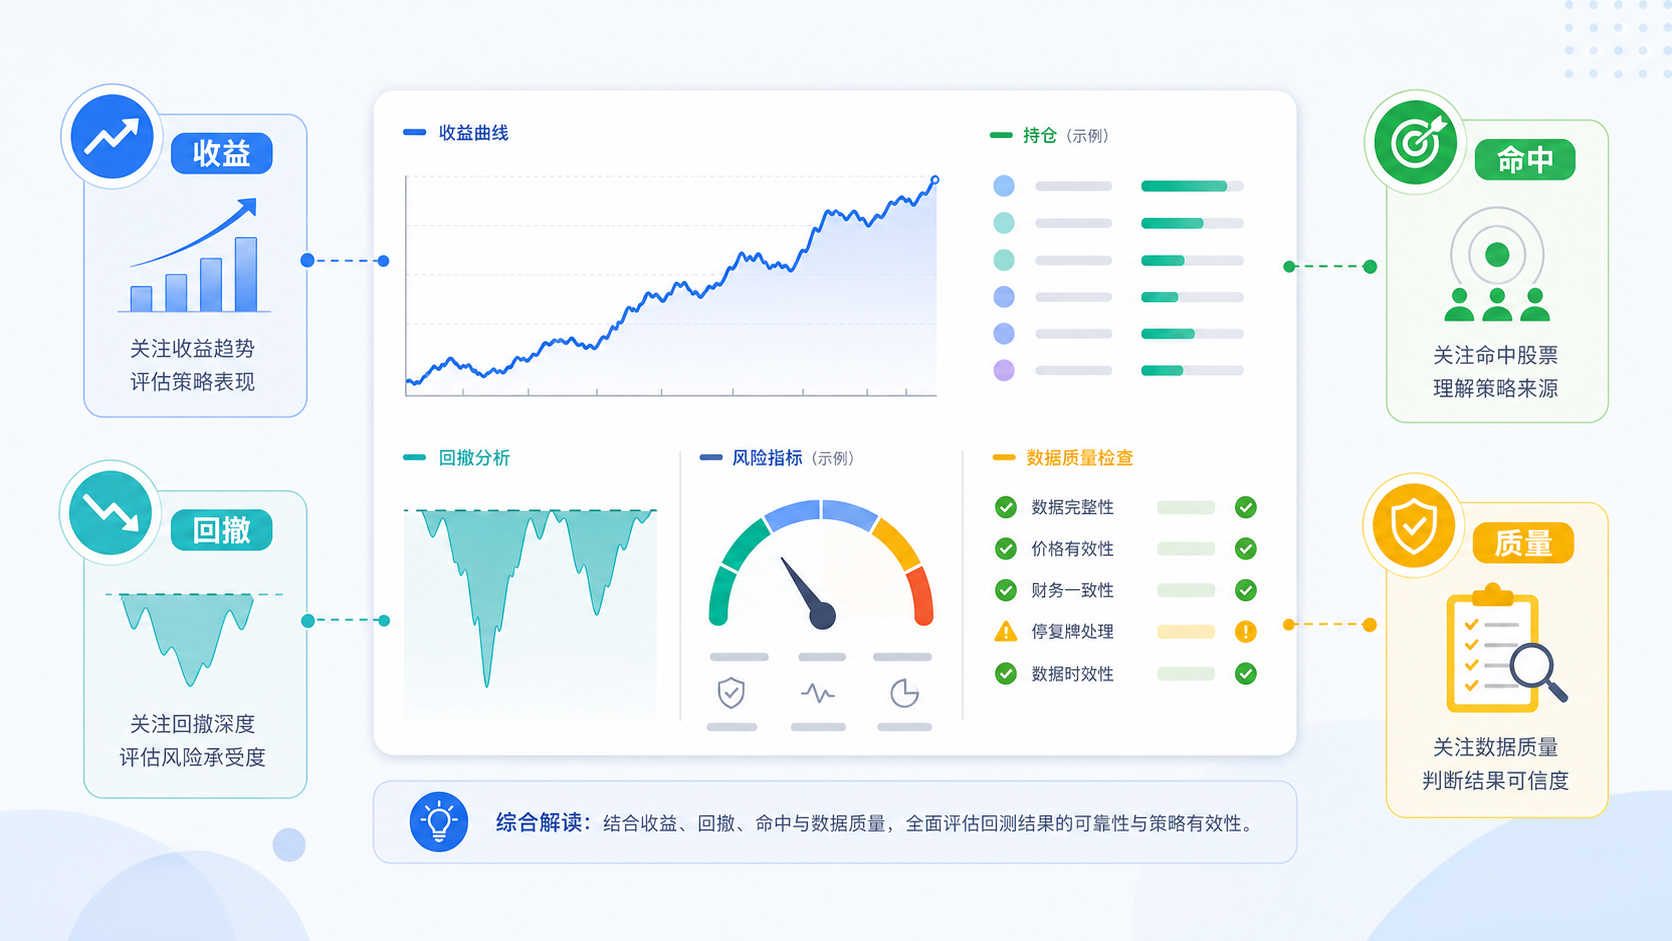
If results include prompts like "data pending completion," "insufficient backtestable stocks," or "insufficient trading days," prioritize resolving data issues first—otherwise, data gaps may be misinterpreted as strategy flaws.
Don't Jump to Conclusions When Data Is Insufficient
Backtest failure doesn't necessarily mean the factor is useless or the strategy is flawed. More commonly, current data can't support your specified conditions.
For example, if you require the past year, Top 30, and at least 80 trading days per stock, but only 20 stocks in the pool meet this, the Bot should clearly explain the coverage gap via QVeris statistics or failure reasons—instead of generating an unreliable curve.
When this occurs, handle it in three ways:
- Supplement local historical market data to expand the backtestable stock pool.
- Relax the backtest period or stock pool (e.g., expand from CSI 300 to a broader candidate universe).
- Reduce Top N or minimum trading day requirements for a preview, then decide whether to tighten conditions.
What a Good Backtest Response Should Look Like
Ask the Bot not only for curves but for a complete conclusion. Practical response structures typically include:
- Backtest setup: Stock pool, period, rebalancing frequency, Top N, fee assumptions.
- Data coverage: Number of stocks, trading days, K-line records, and whether minimum requirements are met.
- Core results: Returns, drawdown, volatility, win rate, and benchmark comparison.
- Holdings and rebalancing: Stocks selected at each rebalancing and whether turnover is excessive.
- Quality prompts: Areas needing verification and conclusions ready for further observation.
This format enables deeper discussion. You can then ask, "Why was drawdown highest during this period?" "How would changing Top 30 to Top 50 affect results?" or "Does the strategy remain effective with a broader stock pool?"—systematically validating ideas step by step.
Final Tip for First-Time Users
Don't start with complex strategies. Begin with a clear factor, a well-defined stock pool, and a moderate time period. Let the Bot run coverage checks and basic performance using QVeris data. Once you understand samples, rebalancing, and risk, gradually add filtering conditions.
The true value of backtesting isn't proving an idea will generate profits—it's helping you identify early: Is the data foundation sound? Where do returns come from? Are the risks acceptable?