
QVeris Integrates Twelve Data: One API for U.S. Stocks, FX, Gold, and Bitcoin
QVeris "New Provider Dispatch" — each edition introduces a newly integrated global data provider, with real test results doing the talking
Last week, a friend who works on quant strategies asked in a group chat: "Is there an API that can pull both U.S. stock candlesticks and technical indicators? Ideally it could also check FX and gold while it's at it. I'm maintaining three data sources right now and it's driving me crazy."
To be honest, before we integrated Twelve Data, that was not an easy request to answer. One provider for market data, another for indicators, another for FX, and each one used a different field format.
Now it is possible. I spent an afternoon running through Twelve Data's APIs end to end: 183 APIs covering U.S. stocks, FX, cryptocurrencies, and commodities. This article records the testing process and what I actually found.
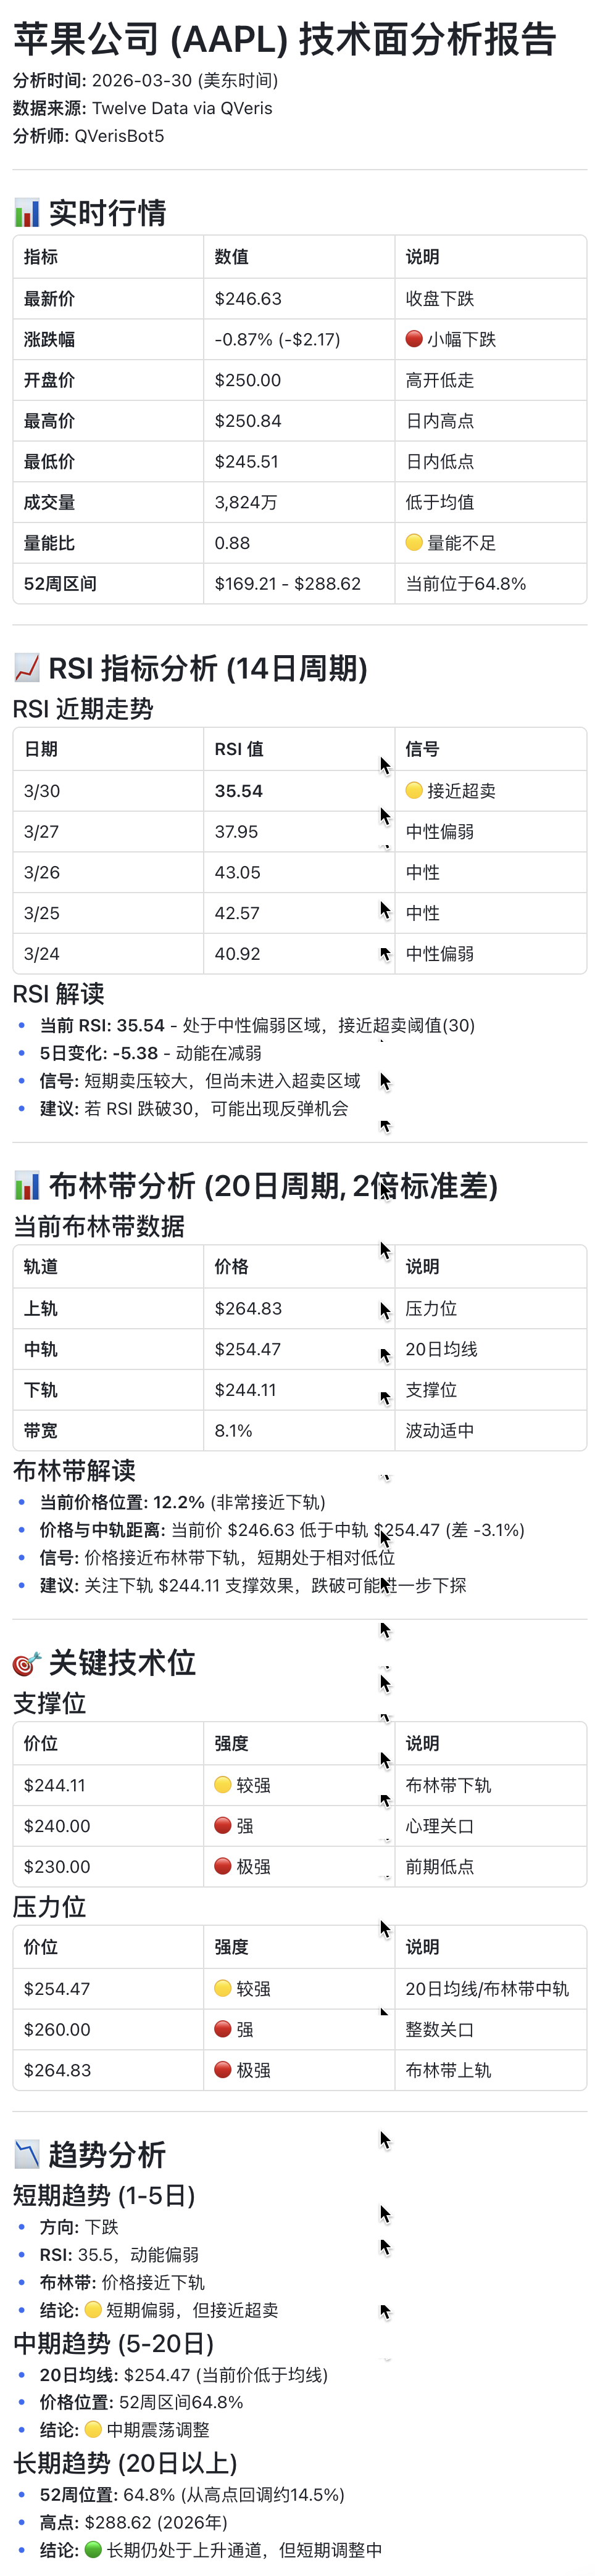
Start with a Complete Technical Analysis of Apple
Instead of listing APIs, let's get hands-on. Suppose you want to judge AAPL's short-term trend. You need three things: recent candlesticks, RSI, and Bollinger Bands. Here is the actual workflow.
Step 1: Pull Daily Candlesticks
The returned data is in standard OHLCV format. The latest bar: open 253.90, high 255.49, low 248.07, close 248.80, volume 47.84 million. It took 382 ms to retrieve complete data for the most recent 60 trading days.
A few details are worth noting:
First, there are 12 interval options, from 1-minute bars to monthly bars, enough for both intraday backtesting and long-cycle analysis.
Second, pre-market and after-hours data are supported, covering the full U.S. equities window from 4:00am to 8:00pm. Not every API offers that.
Step 2: Check RSI
Most technical analysis workflows look like this: pull candlesticks → install TA-Lib locally → calculate indicators yourself. Twelve Data takes a different approach: RSI is calculated server-side and returned directly.
AAPL's current 14-day RSI: 37.95. It is close to the oversold line at 30, but not there yet.
In the RSI chart below, it briefly fell to 17.9 in late January, deep in oversold territory, then rebounded to 69 in early February, near overbought territory, before continuing to slide back toward 38 recently. That trend shift is immediately visible on the chart.
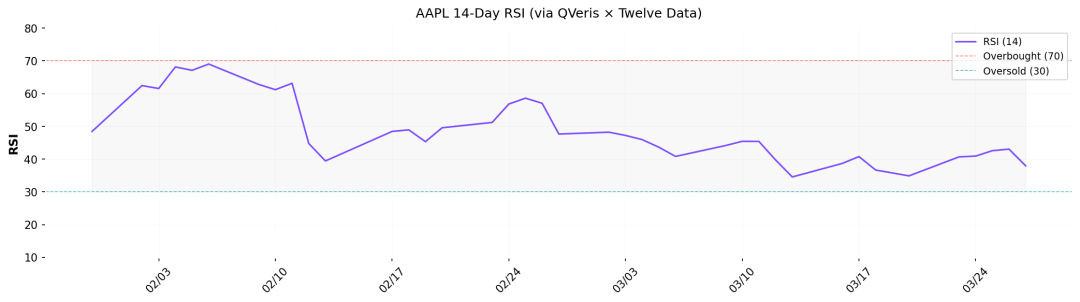
The response came back in 363 ms, with no need to maintain any local technical analysis library. Twelve Data provides 90+ similar indicators: MACD, VWAP, Ichimoku, Supertrend, Stochastic, all returned directly from the server as calculated results. For lightweight strategy development, or for real-time analysis inside an AI Agent, removing the local calculation step makes a real difference.
Step 3: Add Bollinger Bands for Confirmation
Upper band 265.99, middle band 255.38, lower band 244.76. The current price is 248.80, between the middle and lower bands, trading closer to the lower band.
Plotting candlesticks, Bollinger Bands, and volume together:
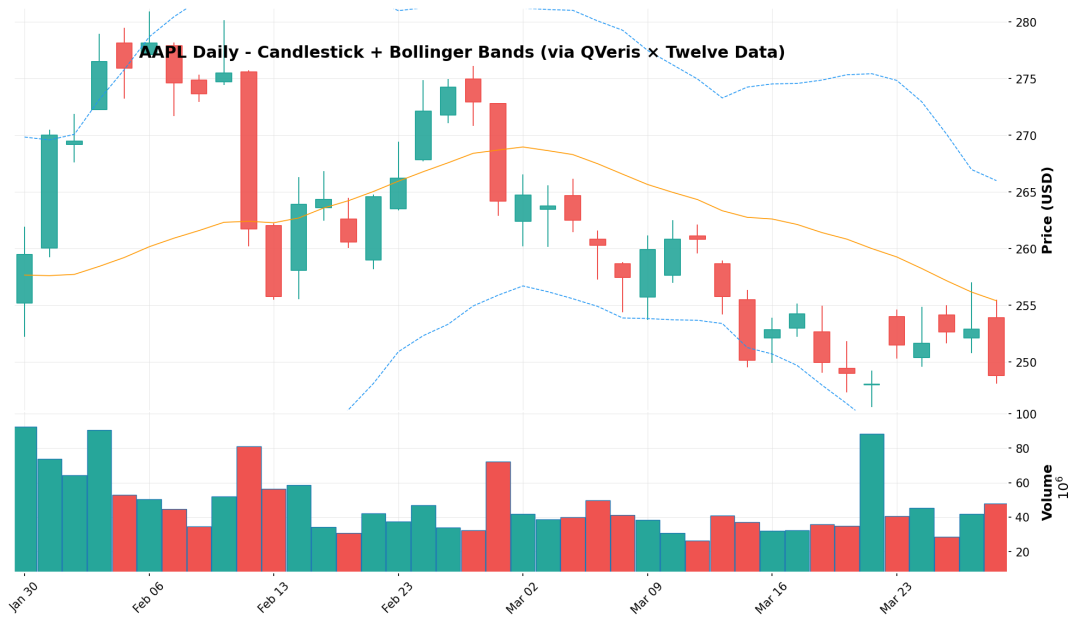
The chart makes it clear: in early February, AAPL rose from 260 to around 280, touched the upper Bollinger Band, then pulled back. Throughout March, it kept oscillating below the middle band, and in the last few days it accelerated toward the lower band. Volume expanded noticeably at key turning points (2/2, 2/12, 3/20).
Combined with RSI at 37.95: the short-term picture is weak, but not yet extremely oversold. If you trade short-term moves, this level is worth watching, but it is not a blind bottom-fishing signal.
Across all three steps, total API call time was under 1.2 seconds. No dependencies to install, no local calculations, no stitching multiple data sources together. The returned data can be used directly to render professional-grade technical analysis charts.
Unexpected Finding: It Is Not Just U.S. Stocks
I originally only planned to test the stock APIs, but Twelve Data's coverage turned out to be much broader than expected.
FX — Query EUR/USD in real time: 1.14927, in 345 ms. It can also perform currency conversion: input 1000 euros, return 1149.27 U.S. dollars. Supports 100+ currency pairs.
Cryptocurrencies — BTC/USD daily data, $67,423, sourced from Coinbase Pro, in 352 ms. This means you can analyze digital assets and traditional assets across markets without switching data sources.
Gold — XAU/USD spot price at $4,533/oz, in 340 ms.
Commodities — This was the most surprising part. One API returned a complete directory of 60 instruments:
In other words, one provider returns stocks, FX, crypto, commodities, and ETFs in one unified format. Pass AAPL and it is a U.S. stock; pass EUR/USD and it is FX; pass BTC/USD and it is Bitcoin; pass XAU/USD and it is gold. The interface design is highly consistent, so switching asset classes carries almost no learning cost.
Fundamentals Are Covered Too
Beyond market data and technical indicators, Twelve Data's fundamentals coverage was also more complete than I expected. Taking Apple's recent data as an example:
Quarterly balance sheet (2025Q4): total assets $379.3 billion, cash $45.3 billion, long-term debt $76.7 billion, shareholders' equity $88.2 billion. One request returned complete details for the most recent 6 quarters, in 372 ms.
EPS earnings tracking: the last three quarters all beat expectations — January 2026 actual EPS $2.84 vs estimated $2.67, a 6.4% beat; October 2025 actual EPS $1.85 vs estimated $1.77, a 4.5% beat. 348 ms.
Dividend history: four dividends over the past year, each $0.26/share, very stable. 381 ms.
With these three APIs combined, an investment research assistant can answer "How has Apple's financial condition looked recently?" in a conversation. It does not just give you a link and ask you to read the filings yourself; it provides conclusions directly, backed by data.
It Is Not Perfect
Two practical issues came up during testing.
The commodities directory API is relatively slow. It took 7.2 seconds to return. Most other APIs were around 300-400 ms, so this one is an order of magnitude slower. It is not a major issue in daily use, since directories do not need to be called frequently, but if you expect every endpoint to respond within a second, this is a noticeable gap.
Also, the historical success rate for some technical indicators is not 100%. The platform-reported success rate is 76% for RSI, 100% for Bollinger Bands, and 83% for MACD Slope. Most failures are parameter-combination issues, such as missing a required symbol, rather than instability in the API itself. Still, it means you need proper error handling for automated calls.
Finally, Twelve Data's strengths are market data and technical indicators. Fundamentals are available, but the depth is not the same as providers dedicated to fundamentals, for example with limited segment reporting and lower ESG score coverage. If your main use case is deep investment research, you may still need to pair it with other data sources.
How to Try It in QVeris
If you are already using the QVeris AI assistant, just say what you need in the conversation:
💬 You: Help me analyze Apple's recent technicals. Check RSI and Bollinger Bands. 🤖 AI: AAPL's current 14-day RSI is 37.95, close to oversold territory. Bollinger Bands show the stock price at 248.80, trading between the middle band (255.38) and lower band (244.76), indicating short-term weakness. However, the latest earnings report showed EPS of $2.84, beating expectations by 6.4%, with no sign of fundamental deterioration.
💬 You: What are gold and Bitcoin trading at now? 🤖 AI: Gold spot is $4,533/oz, and BTC is $67,423. 💬 You: Check Apple's earnings performance over the last few quarters. 🤖 AI: EPS beat expectations in each of the last three quarters: Q1 by 6.4%, Q4 by 5.4%, and Q3 by 4.5%. Total assets were $379.3 billion, cash reserves were $45.3 billion, and the company is financially healthy. It paid dividends 4 times over the past year, each at $0.26/share.
No need to remember endpoint names or parameter formats. Just ask in natural language. QVeris handles the data retrieval, API selection, and formatting behind the scenes.
This is part of QVeris's "New Provider Dispatch" series. We continue to integrate global data providers, and each one is validated through real API calls. Follow QVeris to be the first to learn about newly available data capabilities.
Use this article with a skill
Turn the idea above into an agent workflow. Copy the install command or start with the prompt below.
Stock copilot pro
A finance workflow for quotes, fundamentals, filings, earnings context, and analyst-style summaries.
openclaw skills install stock-copilot-proAnalyze AAPL using live market data, recent fundamentals, valuation context, and the latest relevant filings or news. Separate facts from interpretation and cite which QVeris capabilities were called.
Supply chain bottleneck research
A QVeris-powered investment research workflow that maps value chains, finds scarce layers, ranks public-company research priorities, and cites live data capabilities.
openclaw skills install qveris-supply-chain-researchUse QVeris to deeply research AI infrastructure supply-chain bottlenecks. Map the value chain, discover and inspect finance, filings, news, and company data capabilities, call the needed sources, rank the top 5 public-company research priorities, cite QVeris capabilities used, estimate paid Call count, and explain what could weaken each view.
Alt data demand signal
Use public demand proxies, search, social, app, review, traffic, news, and price reaction to monitor demand shifts.
openclaw skills install qveris-alt-data-demand-signalUse QVeris to find alternative data demand signals for consumer AI apps. Include data sources discovered, capabilities inspected, paid Calls used, estimated credits, evidence gaps, and risks.