
Financial Ratio Analysis
Connect the Signals Across Statements财务比率分析
连接三张报表中的经营信号
Financial ratio analysis turns statement relationships into a connected view of profitability, liquidity, solvency, efficiency, cash quality, and valuation—then explains why they changed.
财务比率分析把报表项目之间的关系转化为盈利、流动性、偿债、效率、现金质量与估值的联动视图,并进一步解释变化原因。
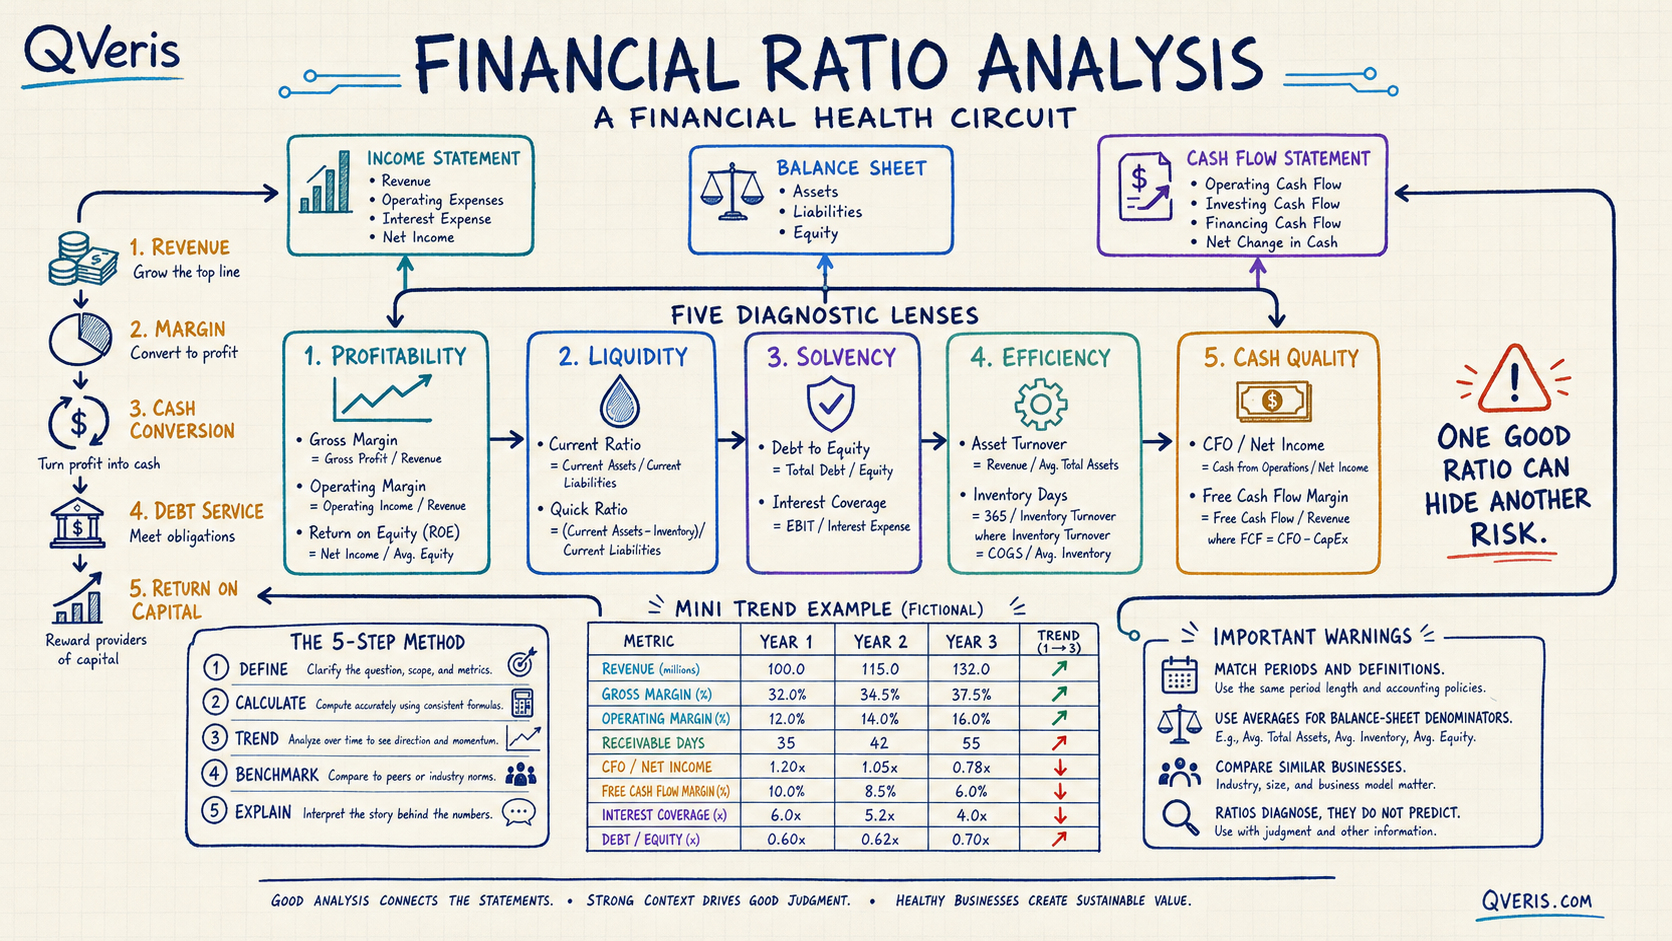
Financial ratio analysis: definition and purpose财务比率分析:定义与用途
Financial ratio analysis calculates relationships among income-statement, balance-sheet, cash-flow, and market data to assess how a business earns, funds operations, converts resources into revenue, services obligations, and creates returns. Ratios standardize companies of different sizes, but they do not automatically make unlike businesses comparable.
财务比率分析计算利润表、资产负债表、现金流量表与市场数据之间的关系,以评估企业如何盈利、为经营融资、把资源转化为收入、偿付义务并创造回报。比率可以标准化不同规模公司,但不会自动让商业模式不同的企业具备可比性。
The output should be a financial story, not a spreadsheet of isolated percentages. Start with a question—margin pressure, working-capital strain, leverage, capital efficiency, earnings quality, or valuation—then choose a small set of ratios that tests that question across time and comparable companies.
分析结果应当形成财务故事,而不是一张孤立百分比表。先从问题出发,例如利润率压力、营运资本紧张、杠杆、资本效率、盈利质量或估值,再选择少量比率,在历史与可比公司中检验问题。
Start with consistent financial statements从口径一致的财务报表开始
Revenue, gross profit, operating income, interest, taxes, and net income describe performance over a period.
收入、毛利润、营业利润、利息、税项和净利润描述一段期间内的经营成果。
Cash, receivables, inventory, debt, liabilities, and equity are measured at a date; averages often align them with flows.
现金、应收账款、存货、债务、负债与权益是时点存量;分析时常用平均值与期间流量匹配。
Operating, investing, and financing cash flows show how accounting results translate into cash and capital allocation.
经营、投资与融资现金流显示会计结果如何转化为现金及资本配置。
Before calculation, align reporting periods, currency, consolidation scope, restatements, continuing operations, and basic versus diluted shares. A mathematically correct ratio built from mismatched inputs is analytically wrong.
计算前应统一报告期间、币种、合并范围、重述、持续经营与基本或稀释股份口径。用错配输入得到的比率即使数学正确,分析上仍然错误。
Five types of financial ratios and what they diagnose五类财务比率及其诊断问题
Profitability ratios盈利能力比率
Gross margin, operating margin, net margin, ROA, ROE, and ROIC show how revenue and capital become profit. Separate operating improvement from leverage and denominator effects.
毛利率、营业利润率、净利率、ROA、ROE与ROIC反映收入和资本如何转化为利润;应区分经营改善、杠杆与分母效应。
Liquidity ratios流动性比率
Current, quick, and cash ratios compare near-term resources with current obligations. Inspect inventory quality, receivable collectability, and the timing of liabilities.
流动比率、速动比率和现金比率比较短期资源与流动义务;还需检查存货质量、应收账款可收回性及负债时点。
Solvency and coverage ratios长期偿债与覆盖比率
Debt-to-equity, net debt-to-EBITDA, interest coverage, and fixed-charge coverage test financing load and capacity to absorb stress.
债务权益比、净债务/EBITDA、利息覆盖及固定费用覆盖检验融资负担与承受压力的能力。
Efficiency and activity ratios营运效率比率
Asset turnover, inventory days, receivable days, payable days, and the cash conversion cycle show how quickly invested resources move through operations.
资产周转率、存货天数、应收天数、应付天数与现金转换周期反映投入资源通过经营循环的速度。
Cash-flow and market ratios现金流与市场比率
CFO-to-net-income and free-cash-flow margin test cash conversion; P/E, P/B, EV/EBITDA, and earnings yield connect fundamentals with market value.
经营现金流/净利润与自由现金流率检验现金转化;市盈率、市净率、EV/EBITDA与盈利收益率把基本面连接到市场价值。
Core financial ratio formulas常用财务比率公式
| Question问题 | Ratio比率 | Formula公式 | Interpretation caution解读注意 |
|---|---|---|---|
| Pricing power定价能力 | Gross margin毛利率 | Gross profit ÷ Revenue | Mix and classification matter产品结构与分类口径重要 |
| Short-term liquidity短期流动性 | Current ratio流动比率 | Current assets ÷ Current liabilities | Not all current assets are equally liquid流动资产变现能力不同 |
| Debt service债务偿付 | Interest coverage利息覆盖 | EBIT ÷ Interest expense | Definitions and lease treatment vary定义与租赁处理不同 |
| Asset use资产使用 | Asset turnover资产周转率 | Revenue ÷ Average total assets | Capital intensity differs by industry行业资本密集度不同 |
| Cash conversion现金转化 | CFO / Net income | Operating cash flow ÷ Net income | Working-capital timing can be temporary营运资本时点影响可能暂时 |
| Equity return权益回报 | ROE | Net income ÷ Average equity | Leverage and buybacks affect the denominator杠杆与回购影响分母 |
Ratio definitions differ among providers and analysts. Label every numerator, denominator, time basis, averaging method, and adjustment instead of assuming a formula is universal.
不同数据提供方与分析师的比率定义可能不同。应明确每个分子、分母、期间、平均方法与调整项,而不是假设公式天然统一。
How to perform financial ratio analysis如何进行财务比率分析
Use horizontal and vertical analysis before ratios比率前先做横向与纵向分析
Horizontal analysis reveals which line items changed over time; vertical analysis shows their share of revenue or assets. These methods identify where to calculate ratios and reduce the risk of treating a ratio change as a mystery.
横向分析揭示报表项目随时间如何变化,纵向分析显示其占收入或资产的比例。两者帮助确定应计算哪些比率,避免把比率变化当成无法解释的结果。
Compare horizontal and vertical analysis比较横向与纵向分析.
Compare trends and economically similar peers比较趋势与经济特征相似的同行
Use at least several consistent periods, note acquisitions or accounting changes, and select peers by business economics rather than exchange or size alone. Industry-specific ratios may be more informative than generic ratios.
应使用多个口径一致期间,标记收购或会计变化,并按商业经济特征而非仅按交易所或规模选择同行。行业专用比率有时比通用比率更有信息量。
Financial ratio analysis example: connect the trend财务比率分析案例:连接趋势而非孤立判断
Consider a fictional three-year case. Revenue and margins rise, but receivable days increase, operating cash conversion weakens, leverage edges higher, and interest coverage falls. The surface profitability story improves while cash and financing resilience deteriorate.
考虑一个虚构三年案例:收入与利润率提高,但应收账款天数上升、经营现金转化减弱、杠杆小幅增加、利息覆盖下降。表面盈利故事在改善,现金与融资韧性却在恶化。
| Metric指标 | Year 1 | Year 2 | Year 3 | Signal信号 |
|---|---|---|---|---|
| Operating margin营业利润率 | 12% | 14% | 16% | Improving改善 |
| Receivable days应收天数 | 35 | 42 | 55 | Investigate需调查 |
| CFO / Net income | 1.20× | 1.05× | 0.78× | Weakening减弱 |
| Interest coverage利息覆盖 | 6.0× | 5.2× | 4.0× | Less headroom余量下降 |
The analytical response is to reconcile receivables with customer growth and revenue recognition, inspect cash-flow adjustments, test debt maturities and rates, and decide whether reported margin expansion is converting into durable cash returns. No one ratio settles the conclusion.
分析师应把应收账款与客户增长及收入确认核对,检查现金流调整,测试债务到期与利率,并判断利润率扩张是否转化为可持续现金回报。任何单一比率都不能决定结论。
Interpret ratios as a connected system把财务比率作为联动系统解读
Margin up, cash conversion down利润率上升、现金转化下降
Check receivables, inventory, contract assets, supplier terms, capitalization, and one-time noncash gains.
检查应收、存货、合同资产、供应商条款、资本化与一次性非现金收益。
ROE up, leverage upROE上升、杠杆上升
Use DuPont analysis to separate margin, turnover, and the equity multiplier.
使用杜邦分析区分利润率、周转率与权益乘数。
Current ratio stable, liquidity weaker流动比率稳定、流动性减弱
Inventory or overdue receivables may replace cash while near-term maturities become more demanding.
存货或逾期应收可能替代现金,同时短期到期义务更加紧迫。
Asset turnover down after acquisition收购后资产周转下降
Separate purchase accounting, goodwill, integration timing, and revenue synergies before judging efficiency.
判断效率前应区分购买会计、商誉、整合时点与收入协同。
Limitations of financial ratio analysis财务比率分析的局限性
Ratios depend on accounting policy, estimates, inflation, seasonality, fiscal calendars, currency, acquisitions, disposals, and management classifications. A year-end balance may not represent the period average. Restatements can change history, and a provider’s precomputed ratio may use a different formula from yours.
比率受会计政策、估计、通胀、季节性、财务日历、币种、收购、处置与管理层分类影响。期末余额不一定代表期间平均状态,重述可能改变历史,数据提供方的预计算比率也可能采用不同公式。
Ratios are backward-looking observations unless forecasts are explicitly used. They help formulate questions and test consistency; they do not prove causality, detect every fraud, establish intrinsic value, or predict returns.
除非明确使用预测,比率通常基于历史观察。它们帮助提出问题并检验一致性,但不能证明因果关系、发现所有舞弊、确定内在价值或预测收益。
An auditable financial ratio workflow with QVeris and FMP使用QVeris与FMP建立可审计的财务比率流程
QVeris can help discover and call relevant FMP financial-statement, key-metric, ratio, price, and estimate capabilities. A reviewable pipeline stores the capability, endpoint, symbol, periods, currency, units, filing dates, raw fields, averaging rules, formulas, adjustments, peer universe, retrieval time, and recalculated output.
QVeris可帮助发现并调用FMP财务报表、关键指标、比率、价格与预期数据能力。可复核流程应保存能力、接口、代码、期间、币种、单位、披露日期、原始字段、平均规则、公式、调整项、同行范围、获取时间与复算结果。
Recalculate critical ratios from raw statements and compare them with provider fields. Investigate differences rather than silently choosing one number. QVeris and FMP do not guarantee data completeness, analytical correctness, or investment performance.
应从原始报表复算关键比率并与提供方字段比较,对差异进行调查,而不是静默选择一个数字。QVeris与FMP不保证数据绝对完整、分析必然正确或投资表现。
FMP financial statements through QVeris通过QVeris使用FMP财务报表 · Return on equity explained净资产收益率详解 · QVeris documentationQVeris文档
Financial ratio analysis FAQ财务比率分析常见问题
What is financial ratio analysis?什么是财务比率分析?
It evaluates relationships among financial-statement and market figures to assess profitability, liquidity, solvency, efficiency, cash quality, and valuation in context.
它评估财务报表及市场数据之间的关系,在具体背景下分析盈利、流动性、偿债、效率、现金质量与估值。
What are the main types of financial ratios?财务比率主要有哪些类型?
Common groups are profitability, liquidity, solvency or leverage, efficiency or activity, cash-flow, and market valuation ratios.
常见类别包括盈利、流动性、长期偿债或杠杆、效率或营运、现金流与市场估值比率。
How do you interpret financial ratios?如何解读财务比率?
Compare consistent periods and similar peers, connect ratios across statements, investigate drivers, and document definitions and unusual items.
比较口径一致的历史期间与相似同行,连接三张报表中的比率,调查驱动因素并记录定义与异常项目。
Which financial ratios are most important?哪些财务比率最重要?
The answer depends on the business and question. Select ratios that test earnings, cash conversion, funding, capital efficiency, and valuation risks relevant to the company.
答案取决于业务与问题。应选择能够检验公司相关盈利、现金转化、融资、资本效率与估值风险的比率。
Why use average balance-sheet values?为什么使用平均资产负债表数值?
Income and cash flow accumulate over a period, while balance sheets show a date. Average assets, inventory, receivables, or equity better align stocks with flows.
利润与现金流在期间内累积,资产负债表反映时点。平均资产、存货、应收或权益能更好地匹配存量与流量。
What are the limitations of ratio analysis?比率分析有哪些局限?
Accounting choices, business differences, seasonality, inflation, acquisitions, one-time items, inconsistent definitions, and historical data can distort comparisons.
会计选择、商业差异、季节性、通胀、收购、一次性项目、定义不一致与历史数据都可能扭曲比较。
References and methodology sources参考资料与方法来源
- CFA Institute — Financial analysis techniques
- CFA Institute — Financial ratio list
- FMP — Financial data API documentation
Educational content only; not investment advice. Ratios are diagnostic tools and cannot establish value or predict performance by themselves.本文仅供教育用途,不构成投资建议。比率是诊断工具,不能单独确定价值或预测表现。