
Free Technical Indicators API
Data, Limits & Python免费技术指标 API
数据、限额与 Python 接入
Compare free technical indicator APIs by markets, calculated fields, intervals, quotas, and data freshness—then integrate one safely in Python.
按市场、指标字段、周期、免费额度和数据时效比较股票技术指标接口,再用 Python 完成可靠接入。
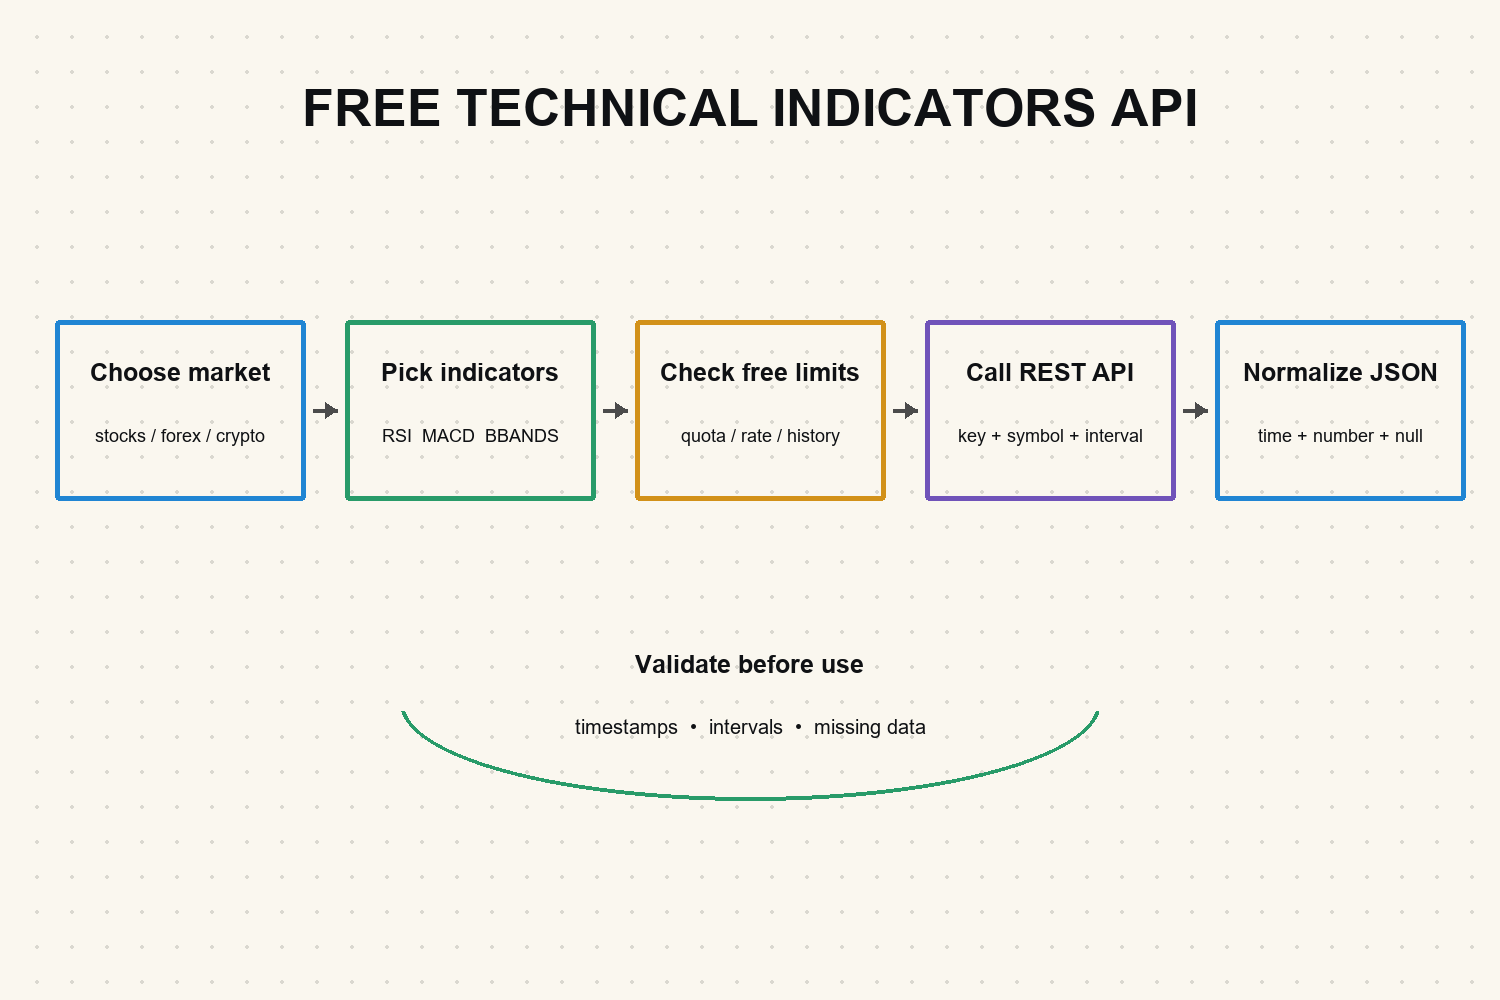
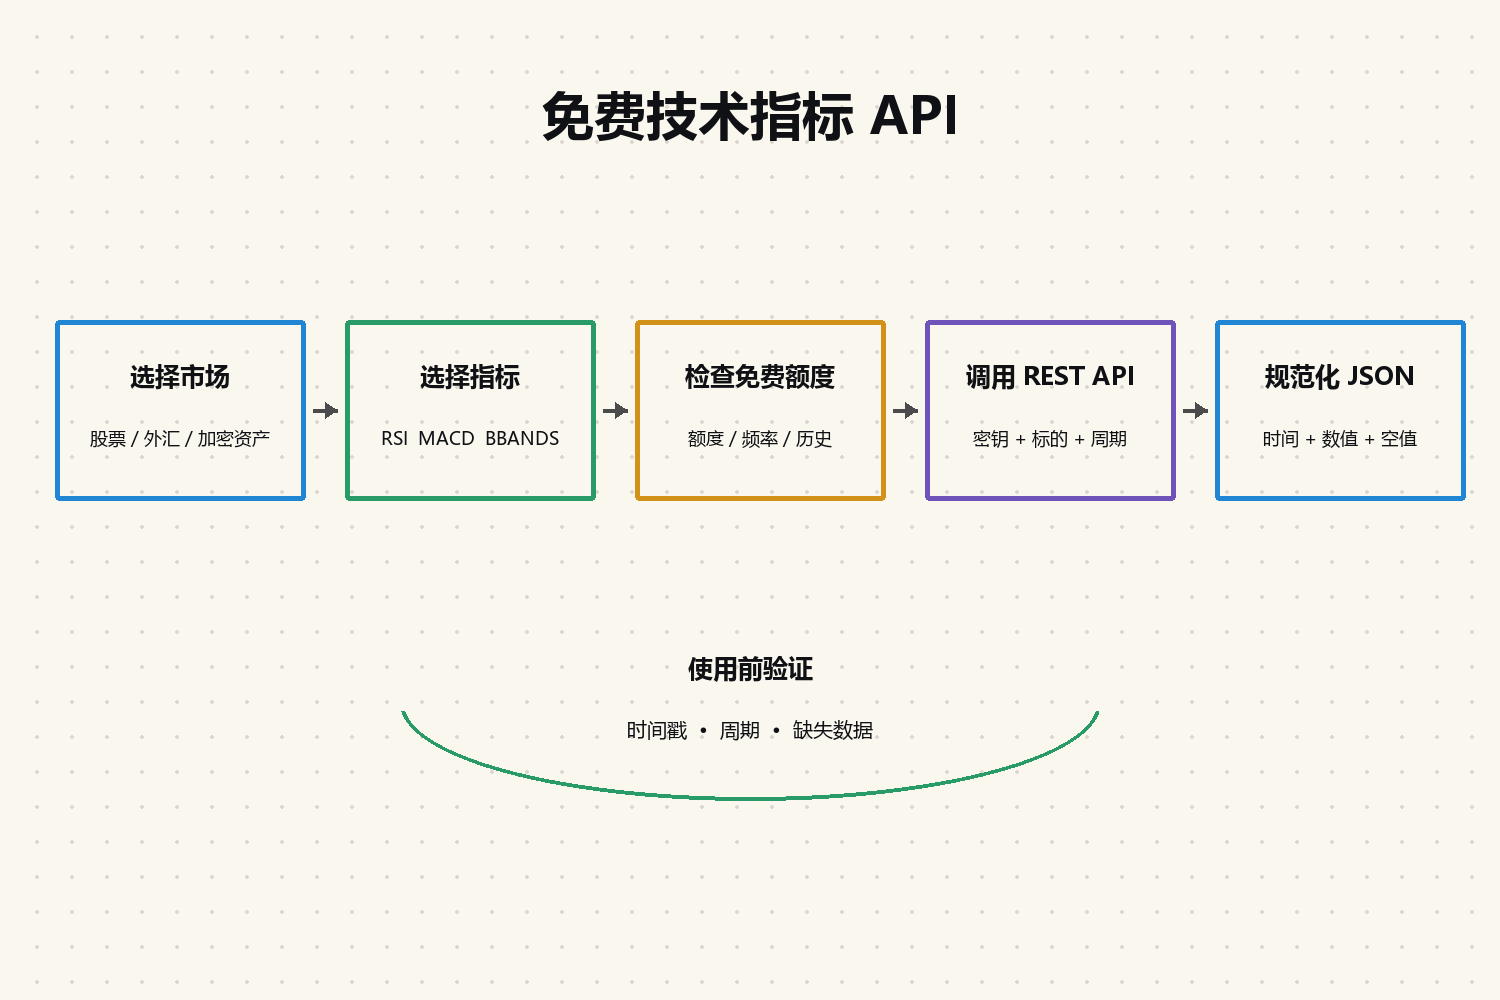
Free technical indicators API: what to verify first免费技术指标 API:先核对什么
Free means a quota
Most offers are limited tiers or trials. Record requests per minute or day, indicator request weights, historical depth, and whether a card is required.
Calculated data needs context
An RSI or MACD value is only reproducible when the symbol, exchange, interval, adjustment method, price source, parameters, timestamp, and candle state are known.
Market coverage comes first
Stock, forex, and crypto support can differ by endpoint. Confirm the exact exchange and instrument before comparing indicator counts.
Build for plan changes
Keep provider-specific JSON behind a normalization layer, cache completed candles, handle HTTP 429, and monitor stale or missing records.
免费通常意味着有限额度
常见的是免费层或试用。应记录每分钟或每日请求数、指标权重、历史深度,以及是否需要绑定付款方式。
计算结果必须带上下文
只有同时知道标的、交易所、周期、复权方式、价格源、参数、时间戳和 K 线状态,RSI 或 MACD 数值才可复现。
先确认市场覆盖
股票、外汇和加密资产可能由不同端点支持。比较指标数量前,先验证具体交易所和证券。
为套餐变化留出空间
用统一模型隔离供应商 JSON,缓存已完成 K 线,处理 HTTP 429,并监控陈旧或缺失记录。
How to compare free technical indicator APIs如何比较免费的股票技术指标接口
Do not choose an API from its indicator count alone. Start with the task: which market, symbol, interval, history window, and update latency does your app require? Then verify the free plan in current vendor documentation.
不要只按指标数量选择接口。先明确应用需要的市场、标的、周期、历史窗口和更新延迟,再以供应商当前文档核对免费方案。
| Check检查项 | What to record应记录内容 | Failure to avoid要避免的问题 |
|---|---|---|
| Markets市场 | Exchange, asset class, symbol format, adjusted data交易所、资产类型、代码格式、复权数据 | Assuming one endpoint covers every market误以为同一端点覆盖所有市场 |
| Indicators指标 | RSI, MACD, SMA, EMA, Bollinger Bands, ATR, parametersRSI、MACD、SMA、EMA、布林带、ATR 与参数 | Comparing names without formulas只比较名称而不核对公式 |
| Free limits免费限额 | Rate, daily quota, request weights, history, attribution频率、每日额度、请求权重、历史范围、署名要求 | Treating a trial as permanent access把试用误当成永久免费 |
| Data quality数据质量 | Timezone, candle close, nulls, revisions, numeric types时区、收盘状态、空值、修订、数值类型 | Trading on incomplete or stale candles使用未完成或陈旧 K 线 |
Direct endpoint or local calculation? A pre-calculated endpoint reduces implementation work and can be useful when an app needs a few indicators at modest frequency. Local calculation is usually easier to reproduce when you already license reliable OHLCV bars, need many parameter combinations, or must keep every formula under version control. Compare the total request budget: one bar request followed by several local indicators can use fewer credits than calling a separate endpoint for RSI, MACD, ATR, and Bollinger Bands. The right choice depends on auditability, data rights, latency, engineering ownership, and cost—not indicator count alone.
应该直接调用指标端点,还是在本地计算?如果应用只需要少量指标、调用频率不高,预计算端点能减少开发工作。若团队已经获得可靠 OHLCV 行情授权,需要大量参数组合,或必须把公式纳入版本控制,本地计算通常更容易复现。还要比较总请求预算:获取一次 K 线后在本地计算 RSI、MACD、ATR 和布林带,可能比逐个调用指标端点消耗更少额度。最终选择应由可审计性、数据权利、延迟、工程归属和成本共同决定,而不是只看指标数量。
Technical indicator API fields, intervals, and history技术指标 API 的字段、周期与历史数据
RSI, MACD, and Bollinger Bands API data
For each series, retain calculation parameters and source timestamps. MACD needs fast, slow, and signal periods; Bollinger Bands need the lookback and deviation multiplier; RSI needs its period and price input.
Real-time versus historical technical indicators
“Real-time” can describe the response rather than the underlying market data. Confirm exchange entitlements, delay, timezone, and whether the latest candle is still forming.
REST JSON schema and missing values
Normalize provider field names into symbol, exchange, interval, timestamp, indicator, parameters, value, and candle status. Preserve nulls instead of silently converting them to zero.
Formula and smoothing conventions
Indicator names do not fully define the calculation. RSI may use Wilder smoothing or another averaging method; MACD depends on EMA initialization; Bollinger Bands can use population or sample standard deviation. Require a formula reference, parameter defaults, price input, precision rule, and methodology version so a later provider change does not silently rewrite your signal history.
Source-bar identity and corporate actions
Store the underlying bar provider, exchange, session, timezone, interval boundary, and adjusted-versus-raw price mode. Split and dividend treatment can materially change long-window moving averages and volatility. For crypto and forex, define venue or composite construction because two feeds can produce different indicators from equally valid but different source prices.
Warm-up, revisions, and point-in-time safety
Long lookbacks need enough earlier bars before the first displayed value. Do not replace warm-up nulls with zero. Record whether completed candles can be corrected and whether historical indicator values are recomputed after a bar revision. A backtest should use values available at that timestamp, not a cleaner series rebuilt later with corrected history.
RSI、MACD 与布林带接口数据
为每组序列保留计算参数与源时间戳。MACD 需要快慢线和信号周期,布林带需要回看周期和标准差倍数,RSI 需要周期与输入价格。
实时技术指标与历史技术指标
“实时”有时只描述响应速度。应确认交易所授权、延迟、时区,以及最新 K 线是否仍在形成。
REST JSON 字段与缺失值
把供应商字段统一为标的、交易所、周期、时间戳、指标、参数、数值和 K 线状态。保留空值,不要静默转成零。
公式与平滑方法
指标名称本身不足以确定计算方式。RSI 可能使用 Wilder 平滑或其他均值方法,MACD 会受到 EMA 初始值影响,布林带也可能采用总体或样本标准差。应要求供应商给出公式依据、默认参数、输入价格、精度规则和方法版本,避免其算法调整后悄然改写历史信号。
底层 K 线身份与公司行动
保存底层行情供应商、交易所、交易时段、时区、周期边界以及复权或不复权模式。拆股与分红会明显影响长周期均线和波动指标。加密货币与外汇还应说明采用单一交易场所还是合成价格,因为两个来源即使都有效,也可能据此计算出不同指标。
预热期、历史修订与时点安全
长周期指标必须先取得足够的前置 K 线,不能把预热阶段的空值替换成零。还要确认已完成 K 线能否被纠正,以及底层行情修订后历史指标是否会重新计算。回测应使用当时实际可见的数值,而不是事后用修正数据重建出的更整洁序列。
For focused examples, see QVeris guides for the free MACD API, free VWAP API, and free Bollinger Bands API.
需要单指标示例时,可查看 QVeris 的免费 MACD API、免费 VWAP API与免费布林带 API指南。
Free technical indicators API in Python: integration steps用 Python 接入免费技术指标 API
1. Choose a documented market and symbol
Test one liquid symbol and one completed interval. Save the provider, endpoint version, timezone, and adjustment setting with your configuration.
2. Send one authenticated REST request
Keep the API key in an environment variable, pass only documented parameters, set a timeout, and log status code plus request ID without logging secrets.
3. Normalize technical indicator JSON
Parse timestamps as timezone-aware values, convert numeric strings explicitly, validate parameters, sort consistently, and reject records that lack a symbol or time.
4. Handle rate limits, caching, and failures
Honor Retry-After, use exponential backoff with jitter, cache completed candles, and distinguish authentication, entitlement, quota, and provider errors.
5. Recalculate a fixed fixture
Save a short OHLCV fixture and reproduce selected values with an independent library or reviewed formula. Compare timestamps, parameters, warm-up rows, and values within an explicit tolerance. Include one split-adjusted stock, one missing interval, and one still-forming candle so the test catches semantic errors rather than only HTTP failures.
6. Monitor the data contract
Track freshness lag, null rate, schema changes, quota consumption, revision frequency, and disagreement with the fixture. Pin endpoint and calculation versions where possible. When validation fails, stop publishing the affected signal or label it unavailable; silently carrying forward an old value makes a dashboard look healthy while the underlying indicator is stale.
1. 选择有文档支持的市场与标的
先用一个流动性较好的标的和已完成周期测试,并保存供应商、端点版本、时区和复权配置。
2. 发送带鉴权的 REST 请求
把密钥放在环境变量,仅传文档支持的参数,设置超时;记录状态码与请求 ID,但不要记录密钥。
3. 规范化技术指标 JSON
按带时区时间解析时间戳,显式转换数字字符串,验证计算参数,统一排序,并拒绝缺少标的或时间的记录。
4. 处理限流、缓存与失败
遵守 Retry-After,使用带随机抖动的指数退避,缓存已完成 K 线,并区分鉴权、权限、额度与供应商错误。
5. 用固定样本独立复算
保存一段简短的 OHLCV 固定样本,再用独立库或经过复核的公式复算部分结果。按照明确容差比较时间戳、参数、预热行和数值。样本中应包含一只发生拆股且使用复权数据的股票、一处缺失周期和一根尚未完成的 K 线,让测试能够发现数据语义错误,而不只是 HTTP 调用失败。
6. 持续监控数据契约
持续记录新鲜度延迟、空值率、Schema 变化、额度消耗、历史修订频率以及与固定样本的偏差,并尽可能锁定端点和计算版本。验证失败时应停止发布受影响信号或明确标记不可用;静默沿用旧值只会让看板看似正常,实际指标早已过期。
Use a time-boxed production acceptance run. For at least five trading sessions, request the same small symbol set on a fixed schedule and retain every response. Define pass criteria before the test: expected market coverage, maximum freshness lag, allowed null rate after warm-up, numeric tolerance against the fixture, successful pagination, and quota headroom at projected traffic. Segment the results by regular and extended sessions rather than averaging them together. A provider that passes daily bars may still fail the intraday workflow your alerting product actually needs.
- Incomplete-candle failure: the newest value changes repeatedly but the response does not expose candle status.
- Formula-drift failure: historical values move after a methodology or default-parameter update without a version marker.
- Corporate-action failure: a split creates a false moving-average or volatility jump because history was not adjusted consistently.
- Quota failure: retries after 429 responses multiply traffic, exhaust the daily allowance, and delay every dependent indicator.
安排一个有明确期限的生产验收期。至少连续五个交易日,按照固定时间表请求同一小组标的,并保存全部响应。测试开始前就写明通过条件:目标市场覆盖、新鲜度最大延迟、预热完成后的允许空值率、与固定样本的数值容差、分页完整性,以及按预计流量计算后的额度余量。正常交易时段与盘前盘后应分开统计,不能混成一个平均值。某个供应商即使能稳定返回日线指标,也可能无法满足提醒产品真正需要的盘中工作流。
- 未完成 K 线故障:最新值反复变化,但响应没有标明 K 线状态。
- 公式漂移故障:方法或默认参数更新后历史值发生变化,却没有版本标记。
- 公司行动故障:拆股前后复权不一致,导致均线或波动率出现虚假跳变。
- 额度故障:429 后的重试放大流量,耗尽每日额度,并拖慢所有依赖指标。
Use QVeris to find a free technical indicators API用 QVeris 查找免费的技术指标接口能力
QVeris can help developers discover and inspect available financial-data capabilities before wiring them into an agent or application. Review the provider’s current documentation and terms for exact markets, limits, and data rights; QVeris does not turn a paid or restricted source into free data.
QVeris 可帮助开发者先发现并检查可用的金融数据能力,再接入 Agent 或应用。具体市场、额度与数据权利仍应以供应商当前文档和条款为准;QVeris 不会把付费或受限数据变成免费数据。
- Open the QVeris tool details for market-data capabilities.
- Inspect inputs, outputs, provider identity, and documentation before calling.
- Use the QVeris documentation to connect verified capabilities to your workflow.
- 在 QVeris 工具详情中搜索市场数据能力。
- 调用前检查输入、输出、供应商身份与文档。
- 参考 QVeris 文档把已检查能力接入工作流。
Free technical indicators API FAQ免费技术指标 API 常见问题
Is there a free API for technical indicators?
Yes. Some providers offer free tiers or trials for pre-calculated indicators, but markets, quotas, delays, and historical depth vary. Verify the current plan before building around it.
Which technical indicators can an API return?
Common endpoints include RSI, MACD, SMA, EMA, Bollinger Bands, ATR, and stochastic oscillators. Formula parameters and market coverage matter more than the headline count.
How do I get technical indicators in Python?
Choose a documented endpoint, send an authenticated request with symbol and interval parameters, then normalize timestamps, numeric values, parameters, and missing records.
Can a free technical indicators API provide real-time data?
Sometimes, but real-time status depends on the underlying market-data license, candle completion rules, exchange coverage, and free-plan limits.
有免费的股票技术指标 API 吗?
有些供应商提供预计算指标的免费层或试用,但市场、额度、延迟和历史深度不同,接入前应核对当前方案。
技术指标接口通常返回哪些指标?
常见指标包括 RSI、MACD、SMA、EMA、布林带、ATR 和随机指标。计算参数与市场覆盖比宣传数量更重要。
如何用 Python 获取股票技术指标?
选择有文档的端点,携带标的与周期参数发送鉴权请求,再规范化时间戳、数值、参数与缺失记录。
免费技术指标 API 能提供实时数据吗?
有可能,但取决于底层行情授权、K 线完成规则、交易所覆盖和免费方案限制。