
Do Typhoons Affect the Stock Market? Using QVeris to Revisit Typhoon Bavi
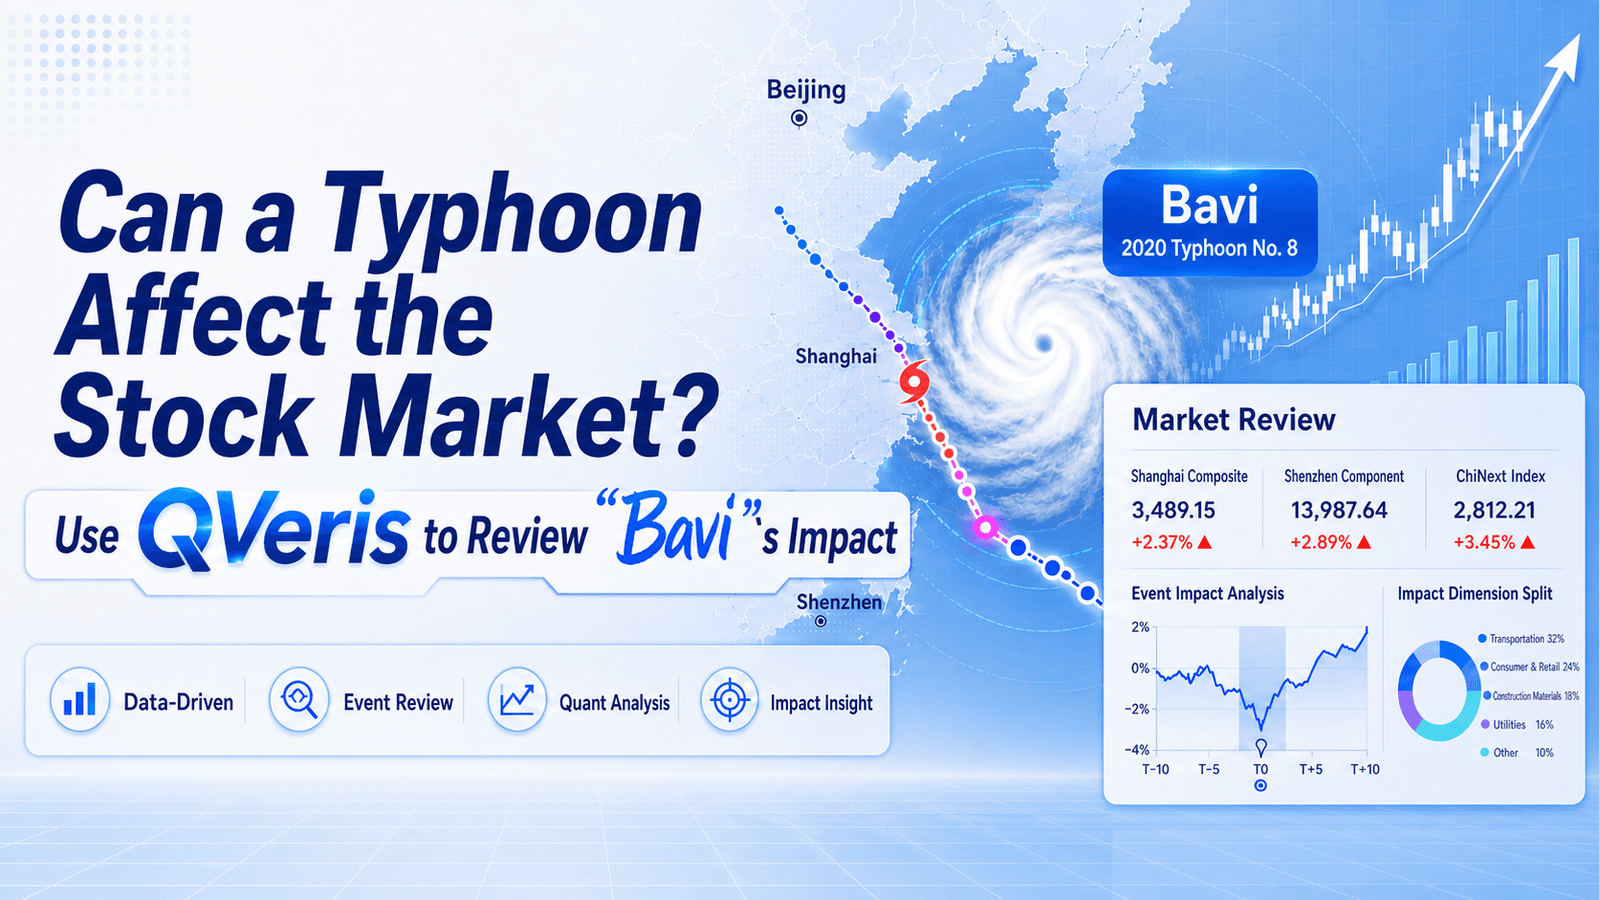
Do Typhoons Affect the Stock Market? A QVeris Reanalysis of the "Bawee" Impact
At 11:20 PM on July 11, the super typhoon "Bawee" made landfall in Yuhuan, Zhejiang, with maximum wind force of 14 levels.
Over 300,000 people in Shanghai were urgently evacuated, ports in Zhejiang and Fujian were completely closed, and large-scale damage occurred to prawn ponds in Ningbo. Social media buzzed with "insurance利好" ("insurance bullish") and "buy flood prevention concept stocks." But if you check the market performance on July 10—the last trading day before the typhoon landed—you'll discover something counterintuitive.
The market wasn't panicking.
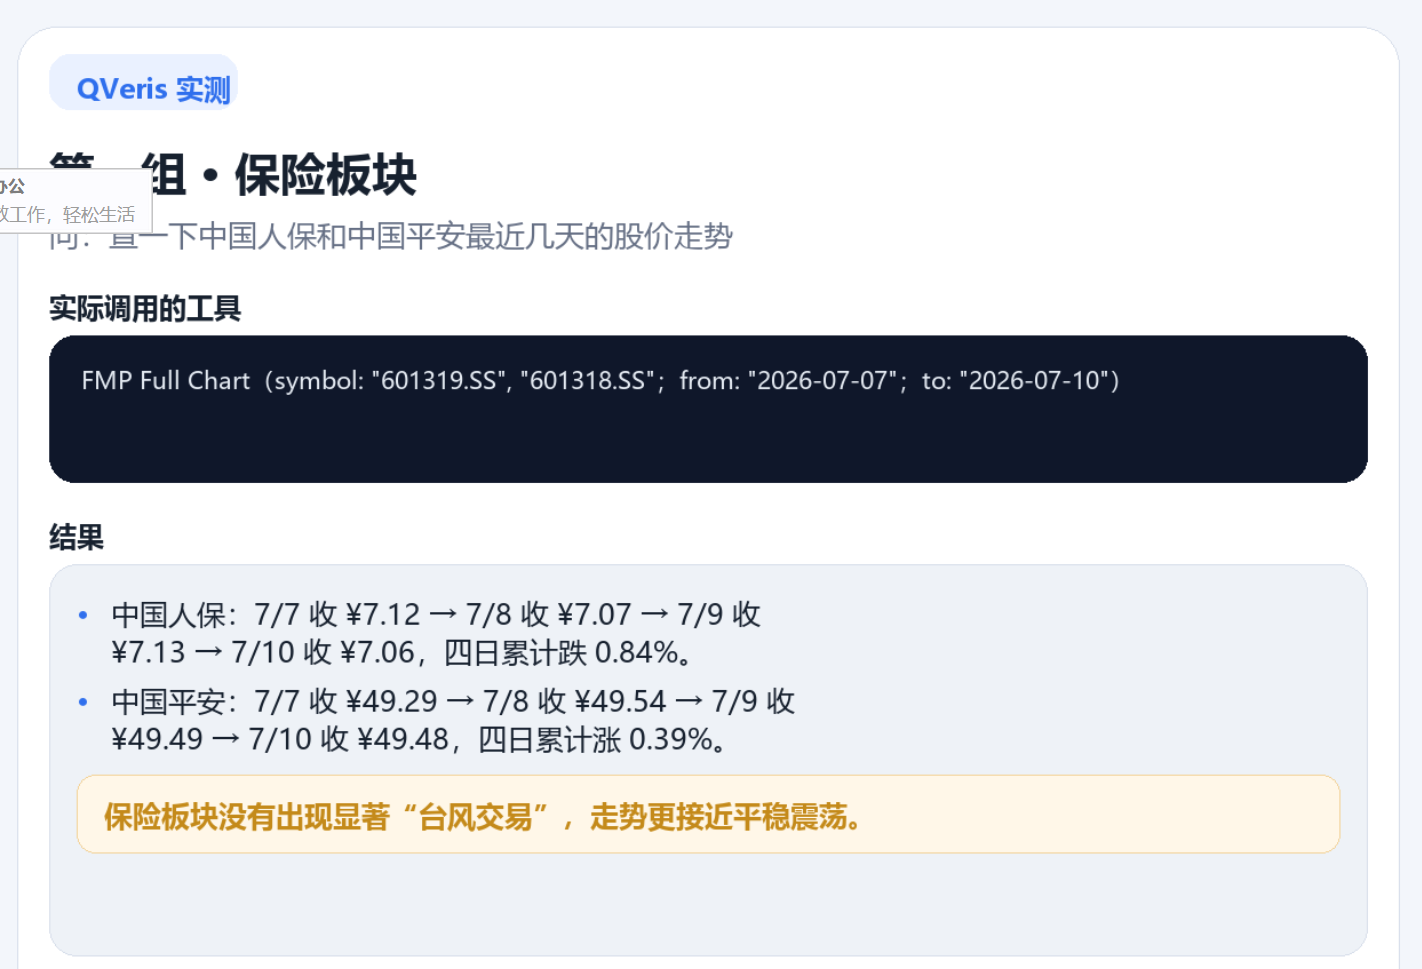
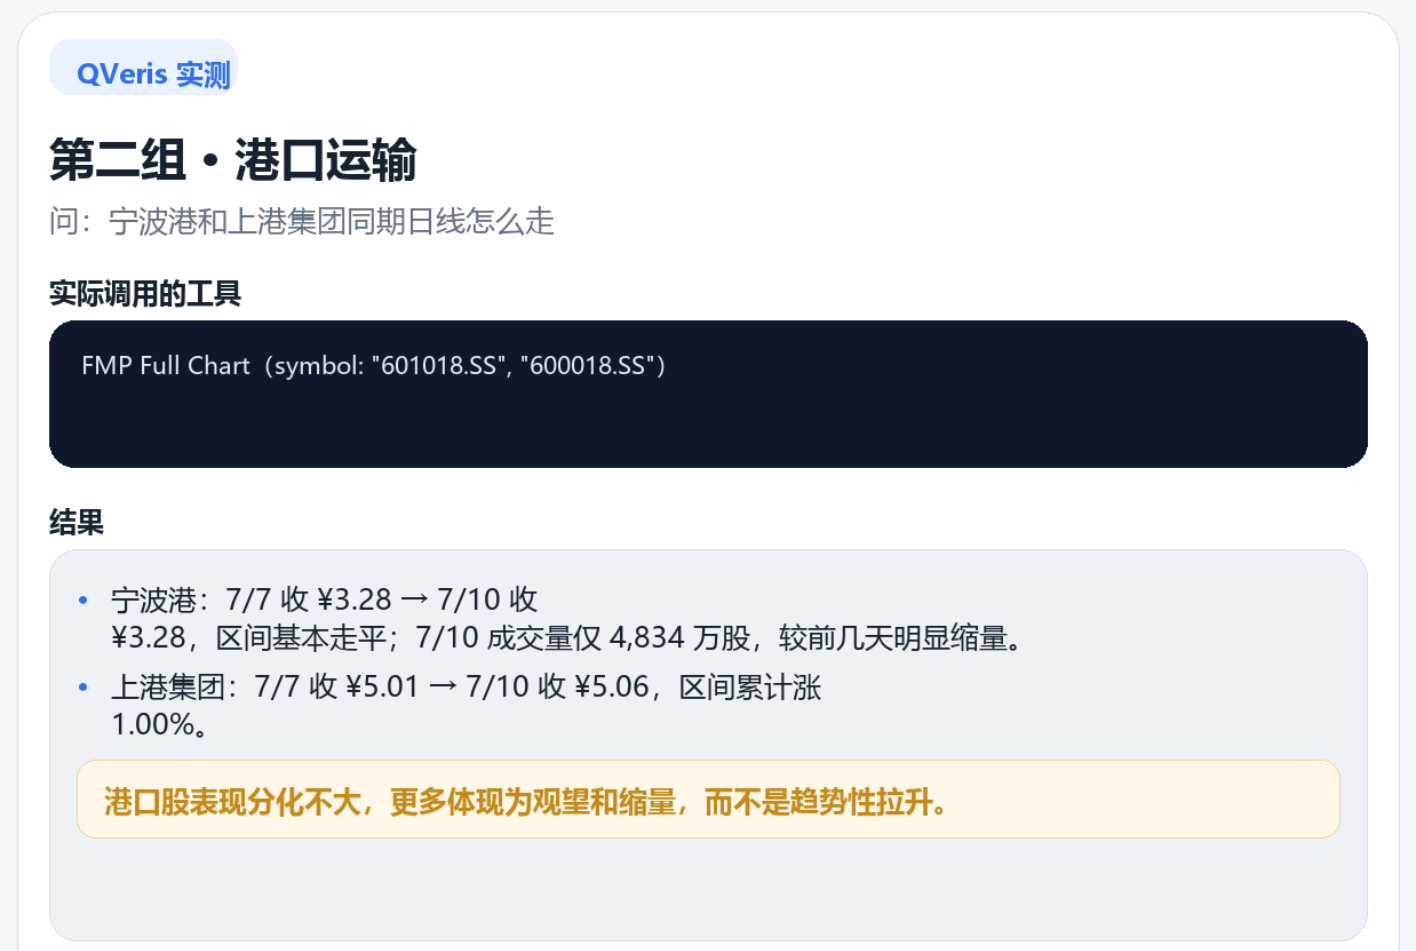
PICC fell 0.84%, the only stock in the affected sector to decline. Ping An Insurance rose 0.39%. Ningbo Port closed flat, while Shanghai International Port Group rose 1%. Huaxin Cement climbed 0.65%. North China Agriculture—wait, this one wasn't just slightly up; it surged 5.49%.
This completely contradicted my mental script. Before a typhoon, insurance should fall (claims pressure), ports should drop (operations halt), building materials should decline (construction stoppage), and agriculture should plummet (crops destroyed). But what actually happened?
Data doesn't lie. We pulled real market data from July 7 to July 10 and found the market wasn't panicking—it was quietly betting on a completely different logic.
First, let's clarify what we tested. Using QVeris, we retrieved FMP's A-share daily data for seven representative stocks across affected sectors: PICC and Ping An Insurance (insurance), Ningbo Port and Shanghai International Port Group (port transportation), Huaxin Cement (building materials), North China Agriculture (agricultural planting), and Zhongshui Fisheries (aquaculture). We also pulled Caidazi's Shenwan first-level industry daily data to analyze overall trends for four sectors during the typhoon week.
Let's start with the first layer—what retail investors intuitively expect.
Common sense suggests three things: insurance will face claims, ports will halt operations, and crops will be flooded. If you searched "Bawee concept stocks" on Xueqiu on July 9, the comments would follow this script. Some calculated claims: "Lekima caused 3 billion yuan in insurance claims last year; Bawee will be similar—fundamentals will collapse this week." Others pre-positioned: "Construction should rise; post-disaster reconstruction is certain."
It all sounds logical. But the actual market performance looked like this:
| Sector | Representative Stock | July 7 Close | July 10 Close | Change |
|---|---|---|---|---|
| Agriculture | North China Agriculture | 11.30 | 11.92 | +5.49% |
| Aquaculture | Zhongshui Fisheries | 7.26 | 7.34 | +1.10% |
| Building Materials | Huaxin Cement | 17.00 | 17.11 | +0.65% |
| Ports | Shanghai International Port Group | 5.01 | 5.06 | +1.00% |
| Ports | Ningbo Port | 3.28 | 3.28 | 0.00% |
| Insurance | Ping An Insurance | 49.29 | 49.48 | +0.39% |
| Insurance | PICC | 7.12 | 7.06 | -0.84% |
Out of seven stocks, five rose, one was flat, and only one fell.
Shenwan industry index trends tell a clearer story. The Agriculture, Forestry, Animal Husbandry, and Fishery sector surged 2.00% on July 10, reversing a 1.51% and 2.35% drop over the previous two days—a more pronounced V-shaped reversal than individual stocks. Transportation rebounded from -2.05% to +0.31%. Construction Materials recovered from -2.61% to +1.08%. The three most affected sectors collectively turned green as the typhoon approached.
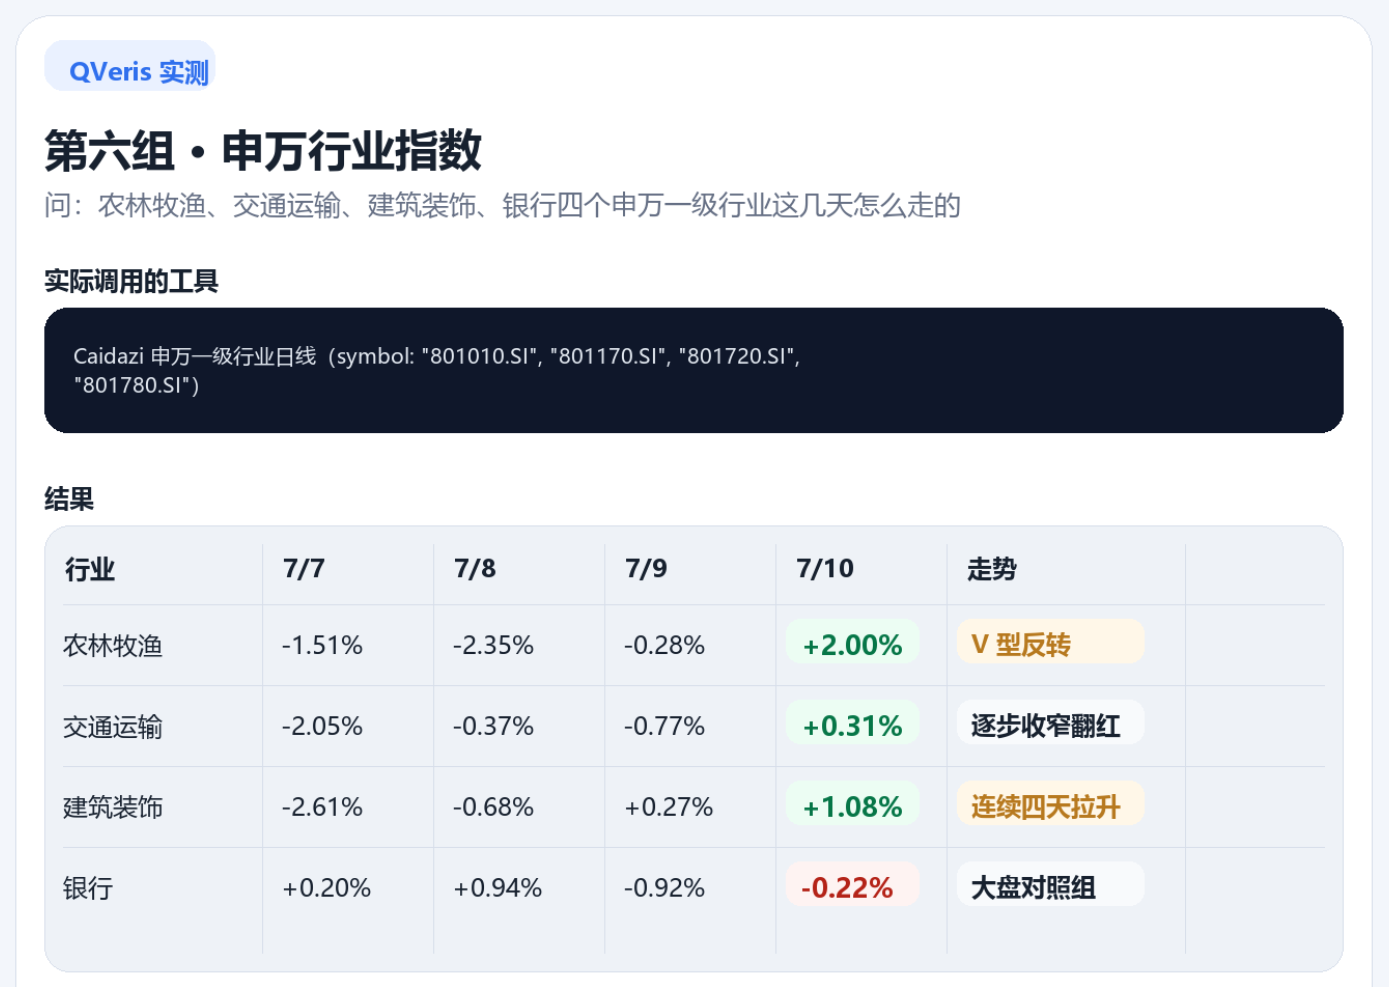
The second layer of truth emerges: retail intuition was entirely wrong. The market didn't follow the "typhoon negative" narrative—it collectively turned green. Why?
The answer lies in the third layer—the market's trading logic is far more complex than simple "bullish/bearish" binary thinking.
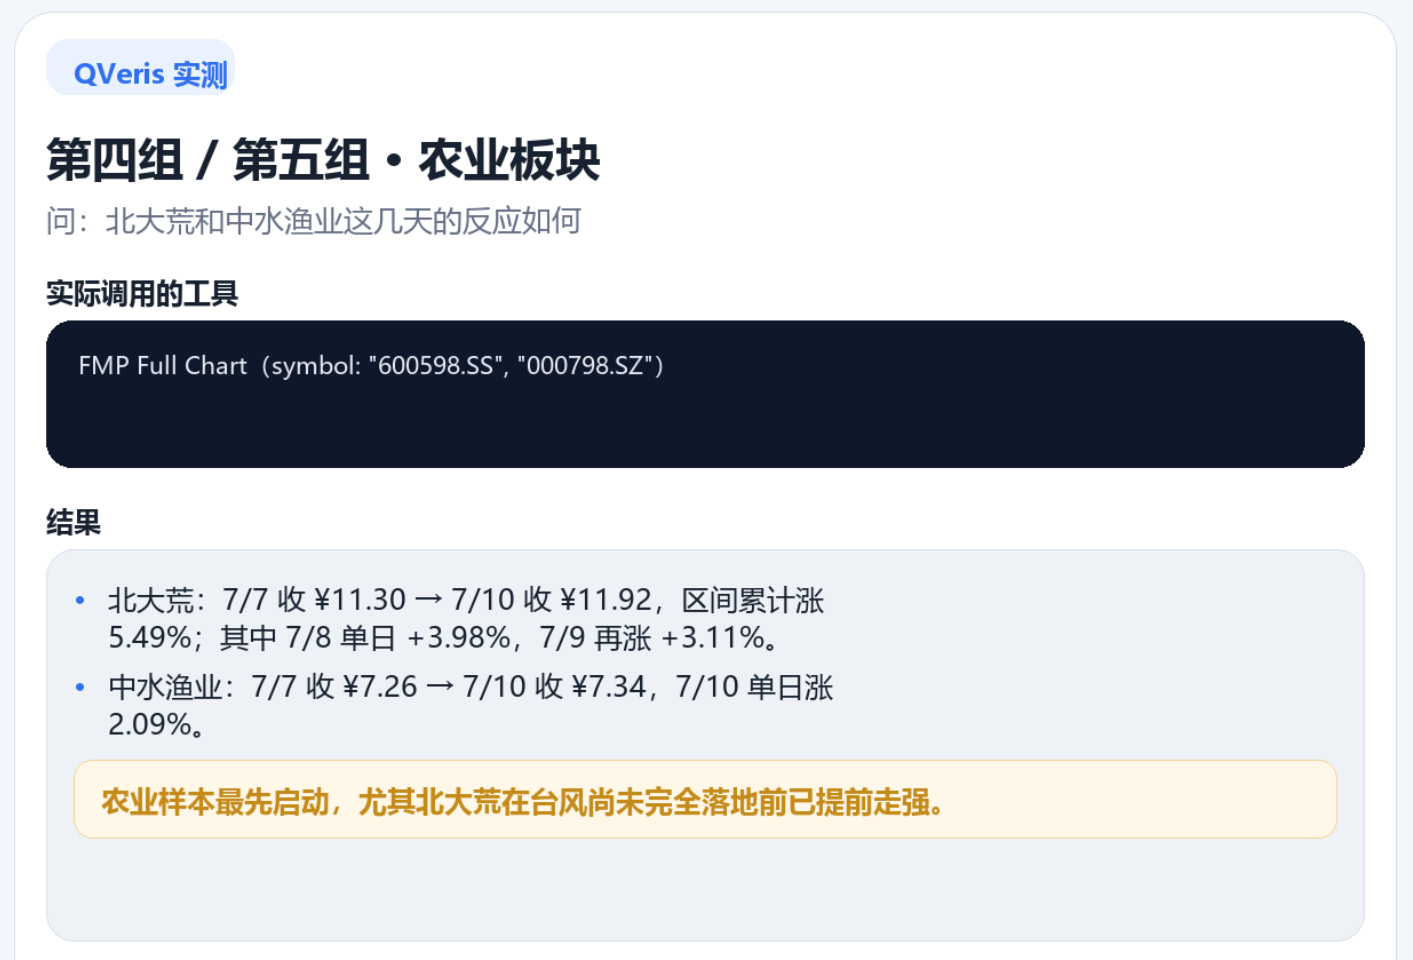
Why did agriculture rise? North China Agriculture's +5.49% wasn't based on imagination. The market was betting on a chain reaction: typhoon damages crops → supply shortage → agricultural product price increases. The supply gap expectation for corn and rice was already reflected in stock prices before the typhoon landed. In 2020, consecutive typhoons in Northeast China directly triggered futures price surges. The market has memory. Zhongshui Fisheries' +1.10% followed the same logic. The impact direction on agriculture depends on whether you stand at the production end (damage) or price end (benefit). On July 10, the market stood at the price end.
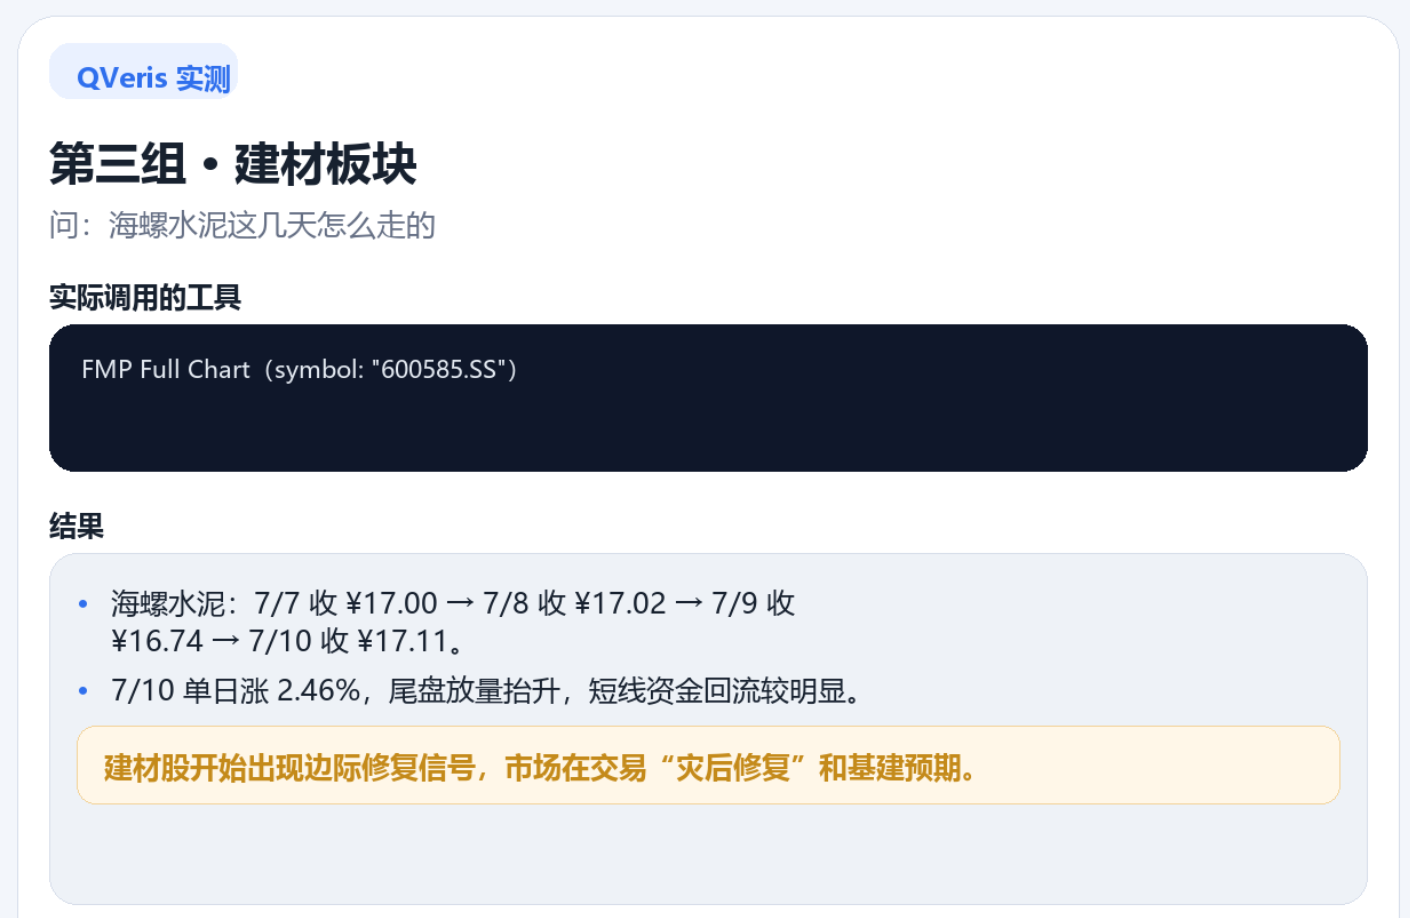
Why did Construction Materials rise? It fell 2.61% on July 7 but rose 1.08% on July 10—the V-shaped recovery marked the "post-disaster reconstruction" expectation taking effect. The market didn't wait for the typhoon to pass; it acted two days early. After Typhoon Lekima in 2019, construction raw materials saw sustained price increases. The market was replicating history.
Insurance stocks were the most counterintuitive—I assumed this sector would be the most certain to fall. The results proved me wrong. Ping An Insurance rose 0.39%, while PICC's -0.84% drop wasn't a collapse. In other words, the market's "typhoon negative" for insurance stocks had been neutralized. After experiencing multiple typhoons—Mangkhut, Lekima, Yagi, and Goni—the market had already priced in the "typhoon discount" for insurance stocks. Those who sold insurance stocks every time a typhoon hit likely sold at the lowest point in the past five years.
Markets learn. That's it. I used to believe typhoons were major negative factors for insurance stocks. Looking back, the negative impact was already priced in—what remained was noise.
What about ports? Shanghai International Port Group rose 1%, while Ningbo Port closed flat. Where was the negative impact of port closures? Ningbo Port fluctuated slightly on July 8-9 but saw trading volume drop to two-thirds of normal by July 10—no panic selling. The market's judgment was calm: closures would last days, not affect long-term value.
To be blunt, the "typhoon concept stock" narrative is just a retail story. Buy insurance, buy building materials, buy flood prevention when a typhoon hits—this might have worked during Typhoon Mangkhut in 2018. By 2026, the market was too smart. Smart enough to have already priced in all price impacts.
Digressing. Back to the data.
One typhoon, seven stocks, four days of data. The sample size is too small for universal conclusions. A different typhoon or timing might yield different results. In 2018, when Typhoon Mangkhut landed, the Shanghai Composite fell over 1%, with 25 stocks hitting the daily limit—because the market was in deleveraging pain, and the typhoon accelerated panic. The typhoon's impact strength depends on market conditions and macro sentiment, not the typhoon's intensity alone.
This is why I don't recommend trading based on typhoon forecasts. Even if you guess the path and intensity correctly, you can't predict what the market has priced into the typhoon at a specific moment.
Data Test Summary
| Ask QVeris | Data Retrieved |
|---|---|
| PICC | ¥7.06, -0.84% (only decline) |
| Ping An Insurance | ¥49.48, +0.39%, unusually stable |
| Ningbo Port | ¥3.28, flat, trading volume contracted |
| Shanghai International Port Group | ¥5.06, +1.00% |
| Huaxin Cement | ¥17.11, +2.46% on July 10 |
| North China Agriculture | ¥11.92, +5.49% cumulatively |
| Zhongshui Fisheries | ¥7.34, +2.09% on July 10 |
| Shenwan Agriculture | Rebounded from -2.35% to +2.00%, V-shaped |
| Shenwan Transportation | Rebounded from -2.05% to +0.31% |
| Shenwan Construction Materials | Rebounded from -2.61% to +1.08% |
Five of seven stocks rose, one was flat, one fell. The three most affected sectors turned green as the typhoon approached. The market wasn't panicking—it was pricing ahead: agriculture rose due to supply shortages driving prices, construction rose due to post-disaster reconstruction demand, while insurance stocks remained calm.
If you want to test similar data, the experience would be like this:
👤 "Pull daily data for PICC, Ping An Insurance, Ningbo Port, Huaxin Cement, and North China Agriculture for the past 5 days."
🤖 "July 7-10: North China Agriculture rose 5.49%, Agriculture sector rose 2.00%. PICC fell 0.84% (only decline among seven). The other five all rose."
👤 "What about Shenwan industry indices? How did they perform as the typhoon approached?"
🤖 "Agriculture rebounded from -1.51% to -2.35% then to +2.00%, V-shaped reversal. Construction Materials rebounded from -2.61% to +1.08%. Transportation rebounded from -2.05% to +0.31%. The three most affected sectors all turned green as the typhoon approached."
👤 "So do typhoons actually affect A-shares?"
🤖 "Yes, but in the opposite direction of intuition. The market wasn't panicking—it was pricing ahead: agriculture rose due to supply shortages driving prices, construction rose due to post-disaster reconstruction demand. Insurance remained calm as claims costs were already priced in."
**Applicability Boundary**: This conclusion is based on FMP A-share daily data and Caidazi Shenwan industry daily data, covering seven stocks and four industry sectors from July 7-10. Suitable for investors seeking to understand real market impacts of unexpected events. Not suitable for short-term trading decisions—typhoon trading profits from timing differences, not trend momentum. Limited sample size; conclusions are for reference only. **QVeris Data Test** — This data comes from multiple suppliers including FMP and Caidazi, retrieved in real-time via QVeris' capability routing network.
QVeris is an AI agent capability routing network—a unified protocol to discover and invoke tens of thousands of real-time data tools.
- For AI assistant users: qveris.cn/plugins (install plugin in 30 seconds, query data with one sentence)
- For developers: npx -y @qverisai/mcp (IDE integration) or npm install -g @qverisai/cli (command line)
- For Agent builders: openclaw plugins install @qverisai/qveris
Website: qveris.cn
Disclaimer: This article is for data analysis and industry research only, not investment advice. Market risk exists; invest with caution. Data sources: FMP and Caidazi, retrieved via QVeris platform. No guarantee of completeness or accuracy; refer to official data.