Historical Stock Price API for AI Agents: Best APIs, Use Cases, and Architecture (2026)
A practical guide to choosing historical stock price APIs for AI agents — covering OHLCV data, adjusted prices, backtesting, trend analysis, portfolio research, rate limits, and unified access through QVeris.
What Is a Historical Stock Price API?
A historical stock price API provides programmatic access to historical market data — daily, intraday, or tick-level prices for stocks, ETFs, and sometimes other assets. For AI agents, these APIs are the foundation for backtesting, trend detection, portfolio review, volatility analysis, and generating historical context for real-time alerts.
Humans look at charts. AI agents need structured historical price data — machine-readable OHLCV bars with precise timestamps, adjusted close prices, and corporate action metadata — to compare, backtest, detect anomalies, and generate research outputs. The key data fields include open, high, low, close, volume, adjusted close, split-adjusted prices, dividend-adjusted prices, timestamp, exchange, currency, and symbol.
The critical differentiators for AI agent use cases are historical depth (how many years back the data goes), adjusted close support (split and dividend adjustments are essential for accurate return calculations), intraday granularity (minute bars vs daily bars), and rate limits (can your agent pull 10 years of data for 50 symbols without hitting a quota wall?).
Why AI Agents Need Historical Price Data
A real-time stock price tells an agent that AAPL moved 3% today. Historical price data tells the agent whether that move is unusual, how often similar moves happened before, whether volume confirmed the move, and how the stock behaved after similar events. Here are the five reasons historical data is non-negotiable for serious financial AI agents:
1. Real-Time Data Needs Historical Context
A 3% daily move means nothing in isolation. Historical data provides the distribution of daily returns, volatility bands, and percentile context — turning a raw price change into an interpretable signal.
2. Backtesting Requires Clean OHLCV Data
Any agent that tests trading rules, factor models, or portfolio strategies needs multi-year OHLCV bars with adjusted close prices. Without adjustments, stock splits and dividends create false signals.
3. Portfolio Agents Need Historical Performance
Portfolio review agents compute historical returns, drawdowns, Sharpe ratios, and correlations. These calculations span months or years — impossible with only current prices.
4. News Agents Need Price Reaction Windows
When an AI agent detects a news event, it needs pre- and post-event price windows to measure market reaction. Historical intraday data enables event-study patterns.
5. Risk Agents Need Volatility and Drawdown History
Risk monitoring agents compute rolling volatility, maximum drawdown, Value-at-Risk, and correlation matrices — all of which require long historical price series.
Historical Stock Price API Comparison for AI Agents
The eight providers below span from free-tier experimentation to institutional-grade historical data. Provider limits and policies change frequently — verify official documentation before production deployment.
| API | Free Tier | Historical Depth | Adjusted Data | Intraday History | Rate Limit | Best For | AI Agent Fit |
|---|---|---|---|---|---|---|---|
| Alpha Vantage | Limited Free | 20+ years | Yes (adjusted close) | Limited (paid) | 25 req/day (free) | Learning, research prototypes | Good for simple daily history; rate limit too low for production agents |
| Finnhub | Limited Free | 20+ years | Yes | Limited | 300 calls/day (free) | Multi-signal agents (news + prices) | Strong for agents combining price history with news and fundamentals |
| Alpaca | Genuinely Free | 5+ years | Yes | Limited | 5 req/sec | US equity portfolio agents | Best free tier for US equity backtesting and portfolio workflows |
| Twelve Data | Limited Free | 20+ years | Yes | Available (paid) | 800 req/day (free) | Multi-asset historical research | Broadest free asset coverage for historical price data |
| FMP | Limited Free | 20+ years | Yes | Limited | 250 req/day (free) | Fundamentals + prices combined | Ideal for agents needing historical prices alongside financial statements |
| Polygon.io | Paid Only | 20+ years (paid) | Yes | Full tick/microsecond | N/A (paid) | Production-grade historical data | Best for production agents needing deep intraday history |
| Databento | Limited Free (250K msg/mo) | Varies by dataset | Yes | Full tick/microsecond | 250K msg/month | Institutional tick-level research | Best for tick-level historical analysis; Python/Rust SDKs |
| Yahoo Finance (unofficial) | Unofficial / Free | 20+ years | Yes | Limited | Unstable | Experiments only | Not recommended for production — no SLA, no contract, APIs change without notice |
Key Historical Price Fields AI Agents Should Inspect
Not all fields are equally important for AI agents. Here is what matters most — and why:
| Field | Why It Matters for AI Agents |
|---|---|
| Open | Detect gap moves — overnight price changes that signal news impact or sentiment shifts |
| High / Low | Measure intraday range — wider ranges indicate higher volatility and potential event impact |
| Close | Daily performance baseline — the most commonly used price for return calculations and charting |
| Adjusted Close | Critical for split/dividend-adjusted analysis. Without it, your agent will misread historical returns. |
| Volume | Confirms the strength of a price move — high volume on a breakout increases signal confidence |
| Timestamp | Required for event windows, timezone alignment, and precise backtesting entry/exit logic |
| Corporate Actions | Prevents false backtest signals — splits, dividends, and mergers distort raw price series |
| Currency / Exchange | Needed for global portfolios — currency effects and exchange-specific quirks matter for multi-market agents |
Adjusted prices matter. Without split and dividend adjustments, an AI agent may misread a 2-for-1 stock split as a 50% price crash — and generate completely misleading analysis. Always verify that your chosen API returns adjusted close prices, and confirm that the adjustment methodology is consistent with your agent's use case.
Historical Stock Price API Use Cases for AI Agents
Six concrete AI agent patterns that depend on historical price data — each with required capabilities, suggested output, and QVeris support guidance.
1. Backtesting Agent
Uses multi-year OHLCV bars to test trading rules against historical data. Requires adjusted close, consistent timestamps, and corporate action metadata. Generates performance metrics: Sharpe ratio, max drawdown, win rate.
QVeris Support: discover historical_prices → inspect schema and adjusted close availability → call selected capability → validate before testing.
2. Portfolio Review Agent
Compares holdings across historical returns, drawdowns, and volatility. Needs multi-symbol historical data with consistent date ranges. Generates comparison tables and allocation recommendations.
QVeris Support: discover multi-symbol history capabilities → inspect batch limits → call → structure comparison output.
3. Price Move Explainer Agent
Compares today's price move with all similar historical moves. Answers "how often does this happen?" and "what happened next?" Uses percentile ranking and historical pattern matching.
QVeris Support: discover historical_prices with date-window → inspect fields → call for context window → generate explainer brief.
4. Earnings Reaction Agent
Checks price behavior in pre- and post-earnings windows. Needs precise date-window history with intraday granularity if available. Flags unusual post-earnings drift.
QVeris Support: discover earnings-date + historical price capabilities → inspect window parameters → call → compare against historical earnings reactions.
5. Risk Monitoring Agent
Tracks rolling volatility, maximum drawdown, correlation matrices, and Value-at-Risk. Requires long, clean historical price series with consistent timestamps.
QVeris Support: discover volatility and correlation capabilities → inspect data range requirements → call → generate risk dashboard inputs.
6. Market Research Agent
Generates historical context for stock research briefs: long-term performance charts, sector comparisons, and historical event impact analysis.
QVeris Support: discover historical context capabilities → inspect sector comparison options → call → structure research brief with source timestamps.
QVeris Support means an AI agent can use QVeris to discover, inspect, and call relevant historical price capabilities through a unified routing layer. QVeris is not the original source of every historical dataset.
How to Choose a Historical Stock Price API for AI Agents
| Use Case | Best Data Requirement | What to Check |
|---|---|---|
| Daily research agent | Daily OHLCV | Adjusted close availability, history depth (5+ years) |
| Backtesting agent | Clean historical bars | Split/dividend adjustment consistency, corporate action coverage |
| Intraday analysis agent | Minute candles | Intraday depth (how many days back), rate limit for high-frequency pulls |
| Portfolio review agent | Multi-symbol history | Batch endpoint support, symbol coverage breadth |
| Event study agent | Date-window data | Timestamp precision, pre/post-event window flexibility |
| Production agent | Stable API contract | SLA guarantees, commercial licensing terms, per-call cost at scale |
If the agent only needs daily context
Daily OHLCV with adjusted close is sufficient. Alpha Vantage, FMP, or Alpaca provide this at minimal cost.
If the agent backtests strategies
Adjusted data is non-negotiable. Verify adjustment methodology across splits, dividends, and spinoffs before committing to a provider.
If the agent monitors many tickers
Batch endpoints and rate limits matter more than individual symbol depth. Check maximum symbols per request and daily quota.
If the agent runs commercially
Licensing terms matter more than free tier size. A paid plan with clear commercial-use rights is safer than a generous free tier with restrictive terms.
If the agent explains news impact
Event-window retrieval is critical. The API must support date-range queries with precise timestamp control for pre/post-event analysis.
Historical Data Architecture for AI Agents
Integrating historical price data into an AI agent follows a six-step pipeline. Each step addresses a decision that the agent must make — not just a data fetch.
1. Define the historical question
What exactly does the agent need to know? "Show me AAPL's last 5 years of monthly returns" is different from "find every instance where AAPL dropped 5% in a day."
2. Discover relevant data capability
Use QVeris Discover to find historical price capabilities that match the data requirement — checking provider, cost, coverage, and field availability.
3. Inspect fields and coverage
Before calling, inspect the schema: Does this capability return adjusted close? What date range is covered? Are corporate actions included? What is the rate limit?
4. Call selected API
Execute the capability with validated parameters — symbol, date range, adjusted flag — through the unified routing layer.
5. Validate the response
Check timestamps for consistency, verify adjusted close values against known split dates, flag missing rows or gaps, and confirm data freshness.
6. Generate agent-readable summary
Structure the validated historical data into a research brief, backtest report, or context document — with source timestamps, field explanations, and uncertainty flags.
Conceptual workflow pattern. Adapt to your agent's specific data requirements and chosen provider capabilities.
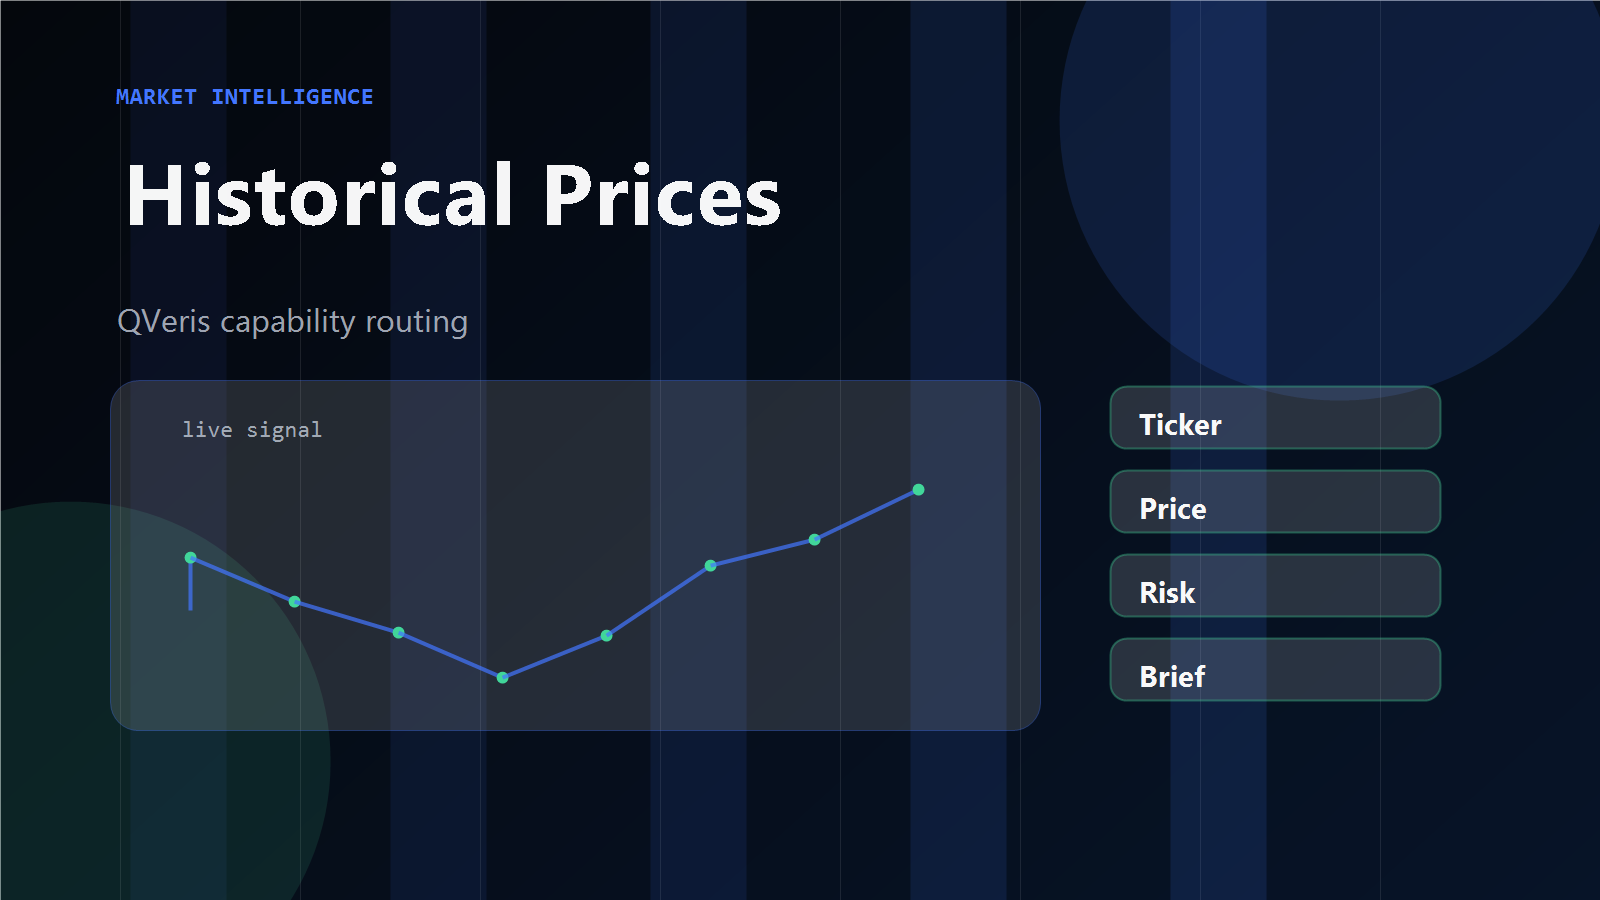
Unified Historical Market Data Access with QVeris
AI agents that directly integrate multiple historical price providers face compounding complexity: different API keys, different symbol formats, different adjusted close definitions, different rate limit windows, different error response formats, and different licensing terms. Each new provider adds integration debt.
QVeris addresses this with a Discover → Inspect → Call → Validate → Report workflow that abstracts away per-provider complexity. An AI agent describes what historical data it needs; QVeris discovers which capabilities match, inspects schemas and costs before execution, and calls the selected capability through a unified interface.
QVeris Support does not mean QVeris is the original source of every historical market dataset. It means an AI agent can use QVeris to discover, inspect, and call relevant historical price capabilities through a unified routing layer — with schema inspection, cost visibility, and provider-agnostic response handling built in. Read the docs → or view pricing →.
Getting Started Checklist
QVeris provides a capability routing layer. Underlying historical market data comes from third-party providers. Limits and coverage are subject to change.
Give Your AI Agent Historical Context
QVeris connects your agent to historical price capabilities across providers. Discover and Inspect are free forever. One unified protocol for backtesting, trend analysis, and research workflows.
Explore QVeris → View PricingStock API Free Comparison →
Deep dive into every free stock API with real tier limits and AI agent compatibility.
Real-Time Stock Price API for AI Agents →
Compare real-time APIs with WebSocket support and AI agent integration patterns.
Market Data API for AI Agents →
Complete comparison of 7 market data providers across equities, crypto, forex, and options.
Free Financial API Comparison →
Compare 12 free financial APIs across stock, crypto, forex, news, and macro categories.
Historical Stock Price API FAQ
What is the best historical stock price API for AI agents?
Do AI agents need adjusted close prices?
Is historical stock data enough for an AI trading agent?
Can I use free historical stock APIs in production?
What fields should a historical stock price API return?
How does QVeris help with historical stock price APIs?
Is this investment advice?
References & Sources
- Alpha Vantage Documentation — alphavantage.co/documentation
- Finnhub Documentation — finnhub.io/docs
- Alpaca Market Data Documentation — docs.alpaca.markets
- Twelve Data Documentation — twelvedata.com/docs
- Financial Modeling Prep Documentation — site.financialmodelingprep.com
- Polygon.io Documentation — polygon.io/docs
- Databento Documentation — databento.com/docs
- QVeris Docs — qveris.ai/docs
- QVeris Pricing — qveris.ai/pricing
- QVeris Guide — Stock API Free Comparison
- QVeris Guide — Real-Time Stock Price API for AI Agents